Feeds:
Posts
Comments

Thanksversity

First, a moment of silence for Freezersaurus (2009-2016); Rest In Recycling. This week we close the door on our years of arctic antics together. A new, uncertain relationship is beginning, with our diversity of icy inhabitants hanging in the balance. A future post will provide an update.freezer

Stomach-Churning Rating: 2/10; no photos, but some politics; take it or leave it.

Speaking of diversity, it’s Thanksgiving in my home of the USA and thus a time for reflection. Such reflections this year inevitably turn to current global events, in which “diversity” has come up in many ways, and then back to my own life, and back again. It certainly has been a year for reflection, and – like many others – my current taste for dystopian tales mirrors that reflection.

In (the United States of) America, Thanksgiving is a tradition of (at least implicitly) commemorating the meeting of two cultures (Native and newly-immigrated American/Puritan) and the eventual fusion/phagocytosis of those two diverse cultures into something new; leading to the USA of today and its diverse inhabitants and cultures. We spend time with family and have awkward conversations or cheer on sports teams or take engorgement-induced naps. We eat diverse foods of the harvest time and thank the spirits/divinity/cooks for their bounty. Many Americans, across our cultural diversity, take time to ponder what they are grateful for. I’ve always loved this holiday because of that, and my fond memories of past Thanksgivings.

And so I am drawn to reflection on the giving of thanks, and the significance of diversity, and I choose today to type some words that echo my thoughts.

I am grateful for what diversity we have. My life is enmeshed with that diversity: I study biodiversity and marvel at the diversity of nature, which both bring great joy to my life. I worry about the state of funding for, and reciprocally the appreciation of, the scientific study of nature and the human value placed on biodiversity, and the implications of those for the future of diverse life on Earth, both human and non-human. It is well known that they are all under threat, in diverse ways, from sociopolitical and other factors.

To me, human diversity (cultural, ethnic, other) is part of this natural diversity; it has evolved and will continue to, for as long as it exists. It is not going away. I am grateful for that human diversity. Some parts of it bring me terrible revulsion, and those are the source of much worry, and our own nature is their source, too. But it brings my life great meaning to interact with different people, to learn new things from them, and to share experiences in more positive ways. I am curious about all of these things, and because of that curiosity in 2016 I have learned more about that human diversity than I ever have before. Some of that learning has been about the dark side of humanity, from political and social trends (or glaring exposure of longstanding biases) in the UK and USA and more globally. Yet also some of that learning has been about the virtues of human diversity and realizing how much solidarity I feel (and have long felt) for those who are trapped in disadvantageous positions along the fault lines of confrontations between different components of that diversity. It has brought out some of my best and worst feelings.

Like a snail, this year I feel that I have periodically been moving forward to inspect the greater world, enjoying it for a time, then recoiling once I encounter the xenophobia, anti-intellectualism, and selfishness, which make me want to stay inside my shell. Long have I inhabited that shell in 2016. I’m not proud of those feelings and that tenancy in my little partition of this world, but they are what I’ve been able to manage. Today, I am trying to appreciate the broader picture and remind myself of where there is still goodness in the world, and how cycles of diversity can stabilize. We have choices to make about how we control those cycles; we humans are unique in our control of them; and those choices are best poised on the understanding that comes from curiosity. It is there in that diversity that Darwin celebrated; “There is grandeur in this view of life,” and today I am thankful for the grandeur that does still remain around us. I am curious to view what grandeur that diversity presents next. We could all use more of that grandeur.

And thanks for reading this post.

(Marcela with some furry friends; photo by Oliver Siddon)

(Marcela with some felid friends; photo by Oliver Siddon)

A guest post by Marcela Randau (m.randau@ucl.ac.uk)

Stomach-Churning Rating: 1/10; just bones and data plots!

It is often said that all cats are very similar in terms of their skeletal morphology (“a cat is a cat is a cat”). But is this really the case? It may be if only gross, qualitative anatomy is taken into consideration, i.e., if you just eyeball the skeletons of tigers and lions you might find yourself not knowing which one is which. But with huge advances in technology that allows for extracting detailed shape information off a structure (e.g., a skull) and for analysing this information (‘Geometric Morphometrics’), it has become more and more possible to distinguish between relatively similar forms – which may be from distinct species, separate sexes, or even just different populations of the same taxon.

And it is reasonable to think that cat skeletons might be a lot more different than what meets the eye, as for a lineage of apparently similarly built animals, with not that much variation in diet  (all cats are hypercarnivores) there is substantial variation in body mass (over 300-fold just in living species!) and in ecology across cat species. From the cursorial cheetah to the arboreal clouded leopard, felids present a wide range of locomotory adaptations. Yes, all cats can climb, but some do it better than others: think lion versus margay (yes, they do descend trees head-first). As hypercarnivores, all cats are meat specialists, but they also change with regards to how big their prey is, with a general and sometimes-not-so-black-and-white three-tier classification into small, mixed and large prey specialists. The rule of thumb is ‘if you are lighter than ~20-25 kg, hunt small stuff. If you are heavier than that, hunt BIG BIG things; bigger than yourself. And if you are in the middle ground, hunt some small-ish things, some big-ish things, and things about your size. Well, -ish’ – their prey size preference has a lot to do with energetic constraints (have a look at Carbone et al. 1999; and Carbone et al. 2007, if you’re interested in this). But the fun bit here is that form sometimes correlates quite strongly with function, so we should be able to find differences in some of their bones that carry this ecological signal.

Indeed, for a while now, we have known that the shape of the skull and limbs of felids can tell us a lot about how they move and how big their prey is (Meachen-Samuels and Van Valkenburgh 2009, 2009), but a large proportion of their skeleton has been largely ignored: we don’t know half as much about ecomorphology and evolution of the vertebral column. Well, it was time we changed this a bit! As the PhD student in the Leverhulme-funded ‘Walking the cat back’ (or more informally, “Team Cat”) project, I’ve spend a big chunk of my first two years travelling around the world (well, ok, mainly to several locations in the USA) carrying a heavy pellet case containing my working tool, a Microscribe, to collect 3-D landmarks (Fig. 1) across the presacral vertebral column of several cat species. And some of first results are just out! Check them out by reading our latest paper, “Regional differentiation of felid vertebral column evolution: a study of 3D shape trajectories” in the Organisms Diversity and Evolution journal (Randau, Cuff, et al. 2016).

cheetah-verts

Fig. 1: Different vertebral morphologies and their respective three-dimensional landmarks. Vertebral images are from CT scans of Acinonyx jubatus (Cheetah, USNM 520539)

Building from results based on our linear vertebral data from the beginning of the year (Randau, Goswami, et al. 2016), the 3-D vertebral coordinates carry a lot more information and we were able to describe how this complex shape-function relationship takes place throughout the axial skeleton (in cats at least) in much better detail than our prior study did. One of the difficulties in studying serial structures such as the vertebral column is that some clades present variation in vertebral count which makes it less straightforward to compare individual vertebrae or regions across species. However, mammals are relatively strongly constrained in vertebral count, and Felidae (cats; living and known fossils) show no variation at all, having 27 presacral vertebrae. So adaptation of the axial skeleton in mammals has been suggested to happen by modification of shape rather than changes in vertebral number.

Using a variety of geometric morphometric analyses, under a phylogenetically informative methodology, we have shown that there is clear shape and functional regionalisation across the vertebral column, with vertebrae forming clusters that share similar signal. Most interestingly, the big picture of these results is a neck region which is either very conservative in shape, or is under much stronger constraints preventing it from responding to direct evolutionary pressures, contrasting with the ‘posteriormost’ post-diaphragmatic tenth thoracic (T10) to last lumbar (L7) vertebral region, which show the strongest ecological correlations.

We were able to analyse shape change through functional vertebral regions, rather than individual vertebrae alone, by making a novel application of a technique called the ‘Phenotypic Trajectory Analysis’, and demonstrated that the direction of vertebral shape trajectories in the morphospace changes considerably between both prey size and locomotory ecomorphs in cats, but that the amount of change in each group was the same. It was again in this T10-L7 region that ecological groups differed the most in vertebral shape trajectories (Fig. 2).

pta-cats

Figure 2: Phenotypic trajectory analysis (PTA) of vertebrae in the T10 – L7 region grouped by prey size (A) and locomotory (B) categories.

So in the postcranial morphology of cats can be distinguished, changing its anatomy in order to accommodate the different lifestyles we see across species. But the distinct parts of this structure respond to selection differently. The next step is figuring out how that might happen and we are working on it.

While Team Cat continues to investigate other biomechanical and evolutionary aspects of postcranial morphology in this interesting family, we’ve been able to discuss some of these and other results in a recent outreach event organised by the University College of London Grant Museum of Zoology and The Royal Veterinary College. We called it “Wild Cats Uncovered: movement evolves”. Check how it went here: (https://blogs.ucl.ac.uk/museums/2016/11/17/cheetah-post-mortem/) and here (http://www.rvc.ac.uk/research/research-centres-and-facilities/structure-and-motion/news/wild-cats-uncovered), with even more pics here (https://www.flickr.com/photos/144824896@N07/sets/72157676695634065/).

References used here:

Carbone, C., Mace, G. M., Roberts, S. C., and Macdonald, D. W. 1999. Energetic constaints on the diet of terrestrial carnivores. Nature 402:286-288.

Carbone, C., Teacher, A., and Rowcliffe, J. M. 2007. The costs of carnivory. PLoS biology 5 (2):e22.

Meachen-Samuels, J. and Van Valkenburgh, B. 2009. Craniodental indicators of prey size preference in the Felidae. Biol J Linn Soc 96 (4):784-799.

———. 2009. Forelimb indicators of prey-size preference in the Felidae. Journal of morphology 270 (6):729-744.

Randau, M., Cuff, A. R., Hutchinson, J. R., Pierce, S. E., and Goswami, A. 2016. Regional differentiation of felid vertebral column evolution: a study of 3D shape trajectories. Organisms Diversity and Evolution Online First.

Randau, M., Goswami, A., Hutchinson, J. R., Cuff, A. R., and Pierce, S. E. 2016. Cryptic complexity in felid vertebral evolution: shape differentiation and allometry of the axial skeleton. Zoological Journal of the Linnean Society 178 (1):183-202.

Time

It has been almost three months since my last post here, and things have fallen quiet on our sister blog Anatomy to You, too. I thought it was time for an update, which is mostly a summary of stuff we’ve been doing on my team, but also featuring some interesting images if you stick around. The relative silence here has partly been due to me giving myself some nice holiday time w/family in L.A., then having surgery to fix my right shoulder, then recovering from that and some complications (still underway, but the fact that I am doing this post is itself evidence of recovery).

Stomach-Churning Rating: 4/10; semi-gruesome x-rays of me and hippo bits at the end, but just bones really.

X-ray of my right shoulder from frontal view, unlabelled

X-ray of my right shoulder from frontal view, unlabelled

Labelled x-ray

Labelled x-ray

So my priorities shifted to those things and to what work priorities most badly needed my limited energy and time. I’ve also felt that, especially since my health has had its two-year rough patch, this blog has been quieter and less interactive than it used to be, but that is the nature of things and maybe part of a broader trend in blogs, too. My creative juices in terms of social media just haven’t been at their ~2011-2014 levels but much is out of my control, and I am hopeful that time will reverse that trend. Enough about all this. I want to talk about science for the rest of this post.

My team, and collaborators as well, have published six recent studies that are very relevant to this blog’s theme- how about we run through them quickly? OK then.

  1. Panagiotopoulou, O., Pataky, T.C., Day, M., Hensman, M.C., Hensman, S., Hutchinson, J.R., Clemente, C.J. 2016. Foot pressure distributions during walking in African elephants (Loxodonta africana). Royal Society Open Science 3: 160203.

Our Australian collaborators got five African elephants together in Limpopo, South Africa and walked them over pressure-measuring mats, mimicking our 2012 study of Asian elephants. While sample sizes were too limited to say much statistically, in qualitatively descriptive terms we didn’t find striking differences between the two species’ foot pressure patterns. I particularly like how the centre of pressure of each foot (i.e. abstracting all regional pressures down to one mean point over time) followed essentially the same pattern in our African and Asian elephants, with a variable heelstrike concentration that then moved forward throughout the step, and finally moved toward the outer (3rd-5th; especially 3rd) toes as the foot pushed off the ground, as below.

African elephant foot COP traces vs. time in red; Asian elephant in orange. Left and right forefeet above; hindfeet below.

African elephant foot COP traces vs. time in red; Asian elephant in orange-yellow. Left and right forefeet above; hindfeet below.

Gradually, this work is moving the field toward better ability to use similar techniques to compare elephant foot mechanics among species, individuals, or over time– especially with the potential of using this method (popular in human clinical gait labs) to monitor foot (and broader musculoskeletal) health in elephants. I am hopeful that a difference can be made, and the basic science we’ve done to date will be a foundation for that.

  1. Panagiotopoulou, O., Rankin, J.W., Gatesy, S.M., Hutchinson, J.R. 2016. A preliminary case study of the effect of shoe-wearing on the biomechanics of a horse’s foot. PeerJ 4: e2164.

Finally, about six years after we collected some very challenging experimental data in our lab, we’ve published our first study on them. It’s a methodological study of one horse, not something one can hang any hats on statistically, but we threw the “kitchen sink” of biomechanics at that horse (harmlessly!) by combining standard in vivo forceplate analysis with “XROMM” (scientific rotoscopy with biplanar fluoroscopy or “x-ray video”) to conduct dynamic analysis of forefoot joint motions and forces (with and without horseshoes on the horse), and then to use these data as input values for finite element analysis (FEA) of estimated skeletal stresses and strains. This method sets the stage for some even more ambitious comparative studies that we’re finishing up now. And it is not in short supply of cool biomechanical, anatomical images so here ya go:

fig5-vonmises

Above: The toe bones (phalanges) of our horse’s forefoot in dorsal (cranial/front) view, from our FEA results, with hot colours showing higher relative stresses- in this case, hinting (but not demonstrating statistically) that wearing horseshoes might increase stresses in some regions on the feet. But more convincingly, showing that we have a scientific workflow set up to do these kinds of biomechanical calculations from experiments to computer models and simulations, which was not trivial.

And a cool XROMM video of our horse’s foot motions:

  1. Bates, K.T., Mannion, P.D., Falkingham, P.L., Brusatte, S.L., Hutchinson, J.R., Otero, A., Sellers, W.I., Sullivan, C., Stevens, K.A., Allen, V. 2016. Temporal and phylogenetic evolution of the sauropod dinosaur body plan. Royal Society Open Science 3: 150636.

I had the good fortune of joining a big international team of sauropod experts to look at how the shapes and sizes of body segments in sauropods evolved and how those influenced the position of the body’s centre of mass, similar to what we did earlier with theropod dinosaurs. My role was minor but I enjoyed the study (despite a rough ride with some early reviews) and the final product is one cool paper in my opinion. Here’s an example:

fig6a-bates-sauropod-com-evol

The (embiggenable-by-clicking) plot shows that early dinosaurs shifted their centre of mass (COM) backwards (maybe related to becoming bipedal?) and then sauropods shifted the COM forwards again (i.e. toward their forelimbs and heads) throughout much of their evolution. This was related to quadrupedalism and giant size as well as to evolving a longer neck; which makes sense (and I’m glad the data broadly supported it). But it is also a reminder that not all sauropods moved in the same ways- the change of COM would have required changes in how they moved. There was also plenty of methodological nuance here to cover all the uncertainties but for that, see the 17 page paper and 86 pages of supplementary material…

  1. Randau, M., Goswami, A., Hutchinson, J.R., Cuff, A.R., Pierce, S.E. 2016. Cryptic complexity in felid vertebral evolution: shape differentiation and allometry of the axial skeleton. Zoological Journal of the Linnean Society 178:183-202.

Back in 2011, Stephanie Pierce, Jenny Clack and I tried some simple linear morphometrics (shape analysis) to see how pinniped (seal, walrus, etc) mammals changed their vertebral morphology with size and regionally across their backbones. Now in this new study, with “Team Cat” assembled, PhD student Marcela Randau collected her own big dataset for felid (cat) backbones and applied some even fancier techniques to see how cat spines change their shape and size. We found that overall the vertebrae tended to get relatively more robust in larger cats, helping to resist gravity and other forces, and that cats with different ecologies across the arboreal-to-terrestrial spectrum also changed their (lumbar) vertebral shape differently. Now Marcela’s work is diving even deeper into these issues; stay tuned…

fig2-randau-measurements

Example measurements taken on felid vertebrae, from the neck (A-F) to the lumbar region (G-J), using a cheetah skeleton.

  1. Charles, J.P., Cappellari, O., Spence, A.J., Hutchinson, J.R., Wells, D.J. 2016. Musculoskeletal geometry, muscle architecture and functional specialisations of the mouse hindlimb. PLOS One 11(4): e0147669.

RVC PhD student James Charles measured the heck out of some normal mice, dissecting their hindlimb muscle anatomy, and using microCT scans produced some gorgeous images of that anatomy too. In the process, he also quantified how each muscle is differently specialized for the ability to produce large forces, rapid contractions or fine control. Those data were essential for the next study, where we got more computational!

mouse-mimics

  1. Charles, J.P., Cappellari, O., Spence, A.J., Wells, D.J., Hutchinson, J.R. 2016. Muscle moment arms and sensitivity analysis of a mouse hindlimb musculoskeletal model. Journal of Anatomy 229:514–535.

James wrangled together a lovely musculoskeletal model of our representative mouse subject’s hindlimb in the SIMM software that my team uses for these kinds of biomechanical analyses. As we normally do as a first step, we used the model to estimate things that are hard to measure directly, such as the leverages (moment arms) of each individual muscle and how those change with limb posture (which can produce variable gearing of muscles around joints). James has his PhD viva (defense) next week so good luck James!

mouse-simm

The horse and mouse papers are exemplars of what my team now does routinely. For about 15 years now, I’ve been building my team toward doing these kinds of fusion of data from anatomy, experimental biomechanics, musculoskeletal and other models, and simulation (i.e. estimating unmeasurable parameters by telling a model to execute a behaviour with a given set of criteria to try to perform well). Big thanks go to collaborator Jeff Rankin for helping us move that along lately. Our ostrich study from earlier this year shows the best example we’ve done yet with this, but there’s plenty more to come.

I am incredibly excited that, now that my team has the tools and expertise built up to do what I’ve long wanted to do, we can finally deliver the goods on the aspirations I had back when I was a postdoc, and which we have put enormous effort into pushing forward since then. In addition to new analyses of horses and mice and other animals, we’ll be trying to push the envelope more with how well we can apply similar methods to extinct animals, which brings new challenges– and evolutionary questions that get me very, very fired up.

Here we are, then; time has brought some changes to my life and work and it will continue to as we pass this juncture. I suspect I’ll look back on 2016 and see it as transformative, but it hasn’t been an easy year either, to say the least. “Draining” is the word that leaps to mind right now—but also “Focused” applies, because I had to try to be that, and sometimes succeeded. I’ve certainly benefited a lot at work from having some talented staff, students and other collaborators cranking out cool papers with me.

I still have time to do other things, too. Once in a while, a cool critter manifests in The Freezers. Check out a hippo foot from a CT scan! It’s not my best scan ever (noisy data) but it shows the anatomy fairly well, and some odd pathologies such as tiny floating lumps of mineralized soft tissue here and there. Lots to puzzle over.

Short post here– I have 4 jobs now opened on my team, 1 short-term one (~4 months or less) and 3 long-term ones (5 years; negotiable down to 2-3 minimum) as follows:

Stomach-Churning Rating: -10/10 Let’s do some SCIENCE!

  1. Research Technician in Vertebrate Anatomical Imaging; until ~1 December 2016 (some flexibility), on our Leverhulme Trust sesamoid bone grant. Lots of flexibility here and on a super fun, established project! Deadline to apply: 11 August (interviews will be 22 August)
  2. Part-time (50%) Research Administrator, on our ERC dinosaur evolution/locomotion grant until 2021. I’m hunting for someone that’s super organized and enthusiastic and not afraid of paperwork (it is EU funding, after all), but there is sure to be some involvement in science communication, too. Deadline to apply: 11 August  (interviews will be 31 August)
  3. Research Technician in Biomechanics; until 2021 as above. This post will not “just” be technical support but hands-on doing science. Some vital experience in biomechanics will be needed as the research will begin very quickly after starting. If the right person applies, we could agree for them to do a part-time PhD or MRes related to the grant research (but that’s not guaranteed in advance). Deadline to apply: 26 August (interviews will be 7/8 September)
  4. Postdoctoral Researcher in Biomechanics; until 2021 as above. This second postdoc on the project will join Dr. Vivian Allen and the rest of my team to push this project forward! I am keenest on finding someone who is good at biomechanical computer simulation, i.e., has already published on work in that general area. But the right person with XROMM (digital biplanar fluoroscopy), other digital imaging and biomechanics experience might fit. Deadline to apply: 23 August (interviews will be 7/8 September)

Update: all jobs have closed for applications.

Update 2: BUT not all the jobs are 5-year contracts. Some may open up again for new people in the future (but not very soon). Stay tuned…

Note that on the bottom of each page linked above, there are Person Specification and Job Description documents that explain more what the jobs are about and what skills we’re looking for in applicants. I strongly encourage any applicants to read these before applying. If those documents don’t describe you reasonably well, it is probably best not to apply, but you can always contact me if you’re not sure.

The project for jobs 2-4 is about testing the “locomotor superiority hypothesis”, an old idea that dinosaurs gained dominance in the Triassic-Jurassic transition because something about their locomotion was better in some way than other archosaurs’. That idea has been dismissed, embraced, ignored and otherwise considered by various studies over the past 40+ years but never really well tested. So in we go, with a lot of biomechanical and anatomical tools and ideas to try to (indirectly) test it! As usual for projects that I do, there is a healthy mix of empirical (e.g. experiments) and theoretical (e.g. models/simulations) research to be done.

Please spread the word if you know of someone right for any of these roles. I am casting a broad net. The next year (and beyond) is going to be a very exciting time on my team, with this big ~£1.9M ERC Horizon 2020 grant starting and lots of modelling, simulation, experiments, imaging and more. Non-EU/EEA/UK people are very welcome to apply– “Brexit” is not expected to affect this project. If you’re not familiar with my team, check out my “mission statement” for what we stand for professionally and as a team. Join us!

I still have my original photocopy, from my grad school days circa 1996, of the 1983 Ted Garland classic paper “The relation between maximal running speed and body mass in terrestrial mammals”, festooned with my comments and highlighter pen marks and other scribblings. That paper remains the backbone of many research questions I am interested in today, and I often think about its underlying concepts. Here’s the key scatterplot from that paper, which I could almost replot by hand from memory, it is so full of implications (and can be clicked to embiggen it, perhaps even speedily depending on your internet connection):

Garland 1983- max speed

Stomach-Churning Rating: 1/10; data and their ramifications; offal-free.

The major points (IMO there are less exciting ones about which theoretical scaling model the data best fit) of the paper are: (1) the fastest-running mammals are neither the smallest nor largest, but those around ~100 kg body mass; (2) if you fit a linear equation to the data (see above; hashed line), it seems like speed increases with body mass linearly (with no limit to that increase, within the body mass range of the data), but if you analyze individual groups of mammals they either don’t change speed significantly with size or they get slower– refer back to point #1 and the polynomial regression that is shown in the figure above (curved line). That’s the biological-question-driven science at the core of the paper (with some methods-y questions at their foundation; e.g. should we use a linear or polynomial regression to fit the data? The latter fits best, and gives a different answer from the former, so it matters.).

But what also fascinates me is the question of data. As the author, who taught me Evolution as an undergrad at U Wisconsin (this had a big impact on me), fully admits in the paper, the ~3-page table of data “necessarily sacrifices some accuracy for completeness”. This paper is about a big question, how mammal speed changes with size, and so its big question explicitly allows for some slop in the data (I will return to this issue of slop later). But given that very few of the data points have very accurate measurements for speed, or for body mass for that matter, how much can we trust an x-y plot of those data, no matter what method is used? Oh there is so much opportunity here for geeky pedantry and niggling scrutiny of data points, true, but hold on…

Plenty of follow-up papers have mused over that latter question, and spin-off ones. Here are some of their plots, re-analyzing the same or very similar data in different contexts. A look at how these papers examine these data and related questions/methods leads into some avenues of science that fascinate me:

Garland 1988- max perf

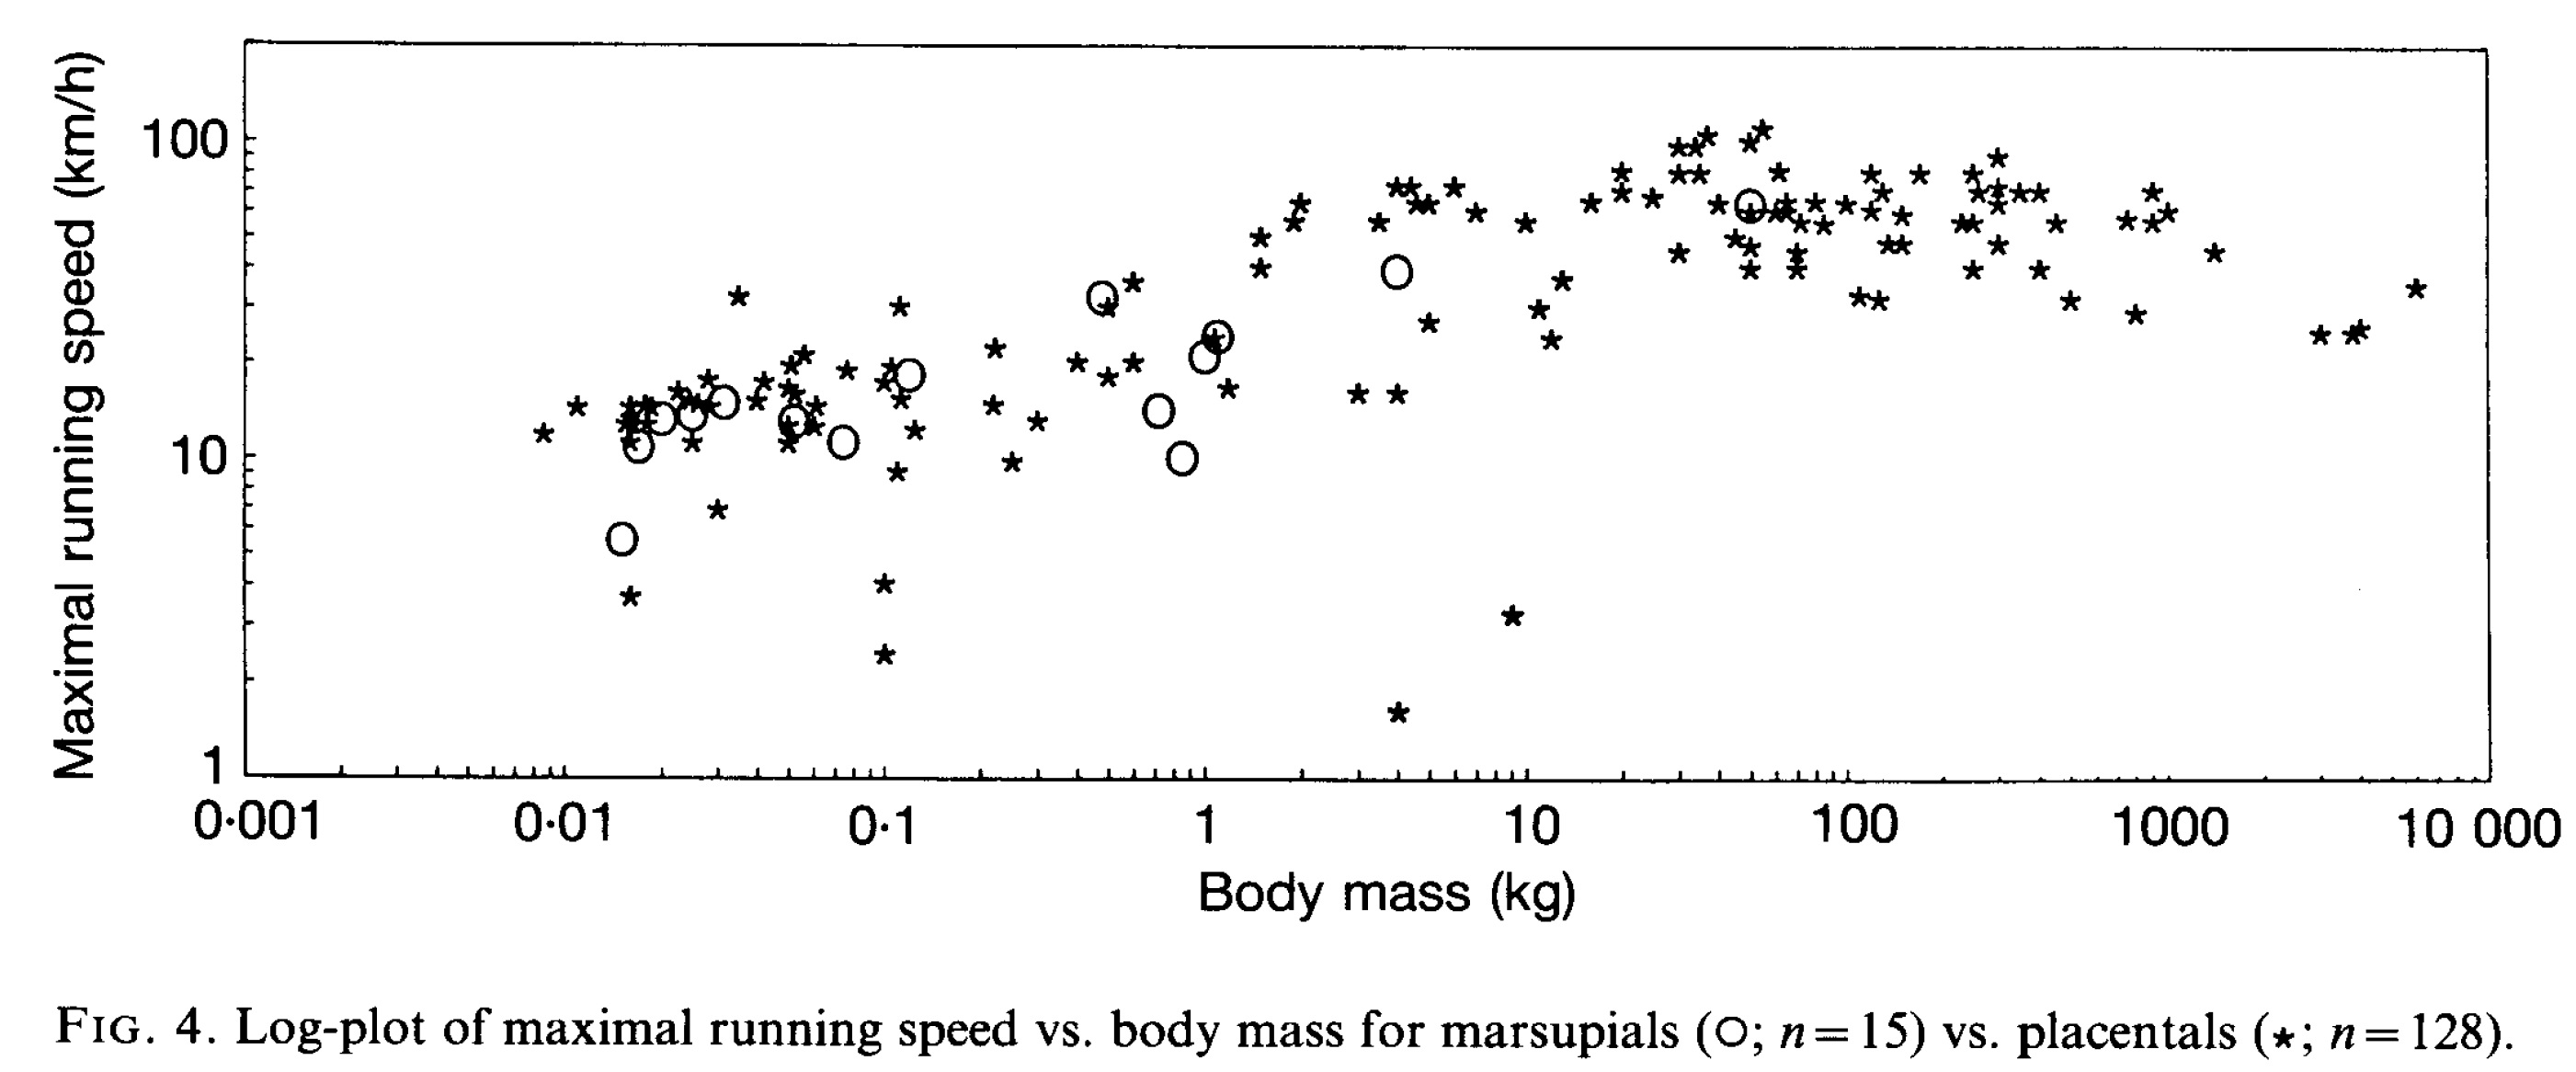
Garland and Baudinette (link to pdf here) checked whether placental (i.e. most; including us) mammals could run/hop faster than marsupial (pouched; e.g. kangaroos) mammals. Their results said “not really”, as the plot intimates. Scatter in the data, especially between 0.01-10 kg, confounds the issue- there’s a lot of specialization going on (notably, animals that are very slow for their size, e.g. sloths). But marsupials are not, as had been suggested before, inferior to placentals in some basic way such as running ability.

GarlandJanis1993-Fig5

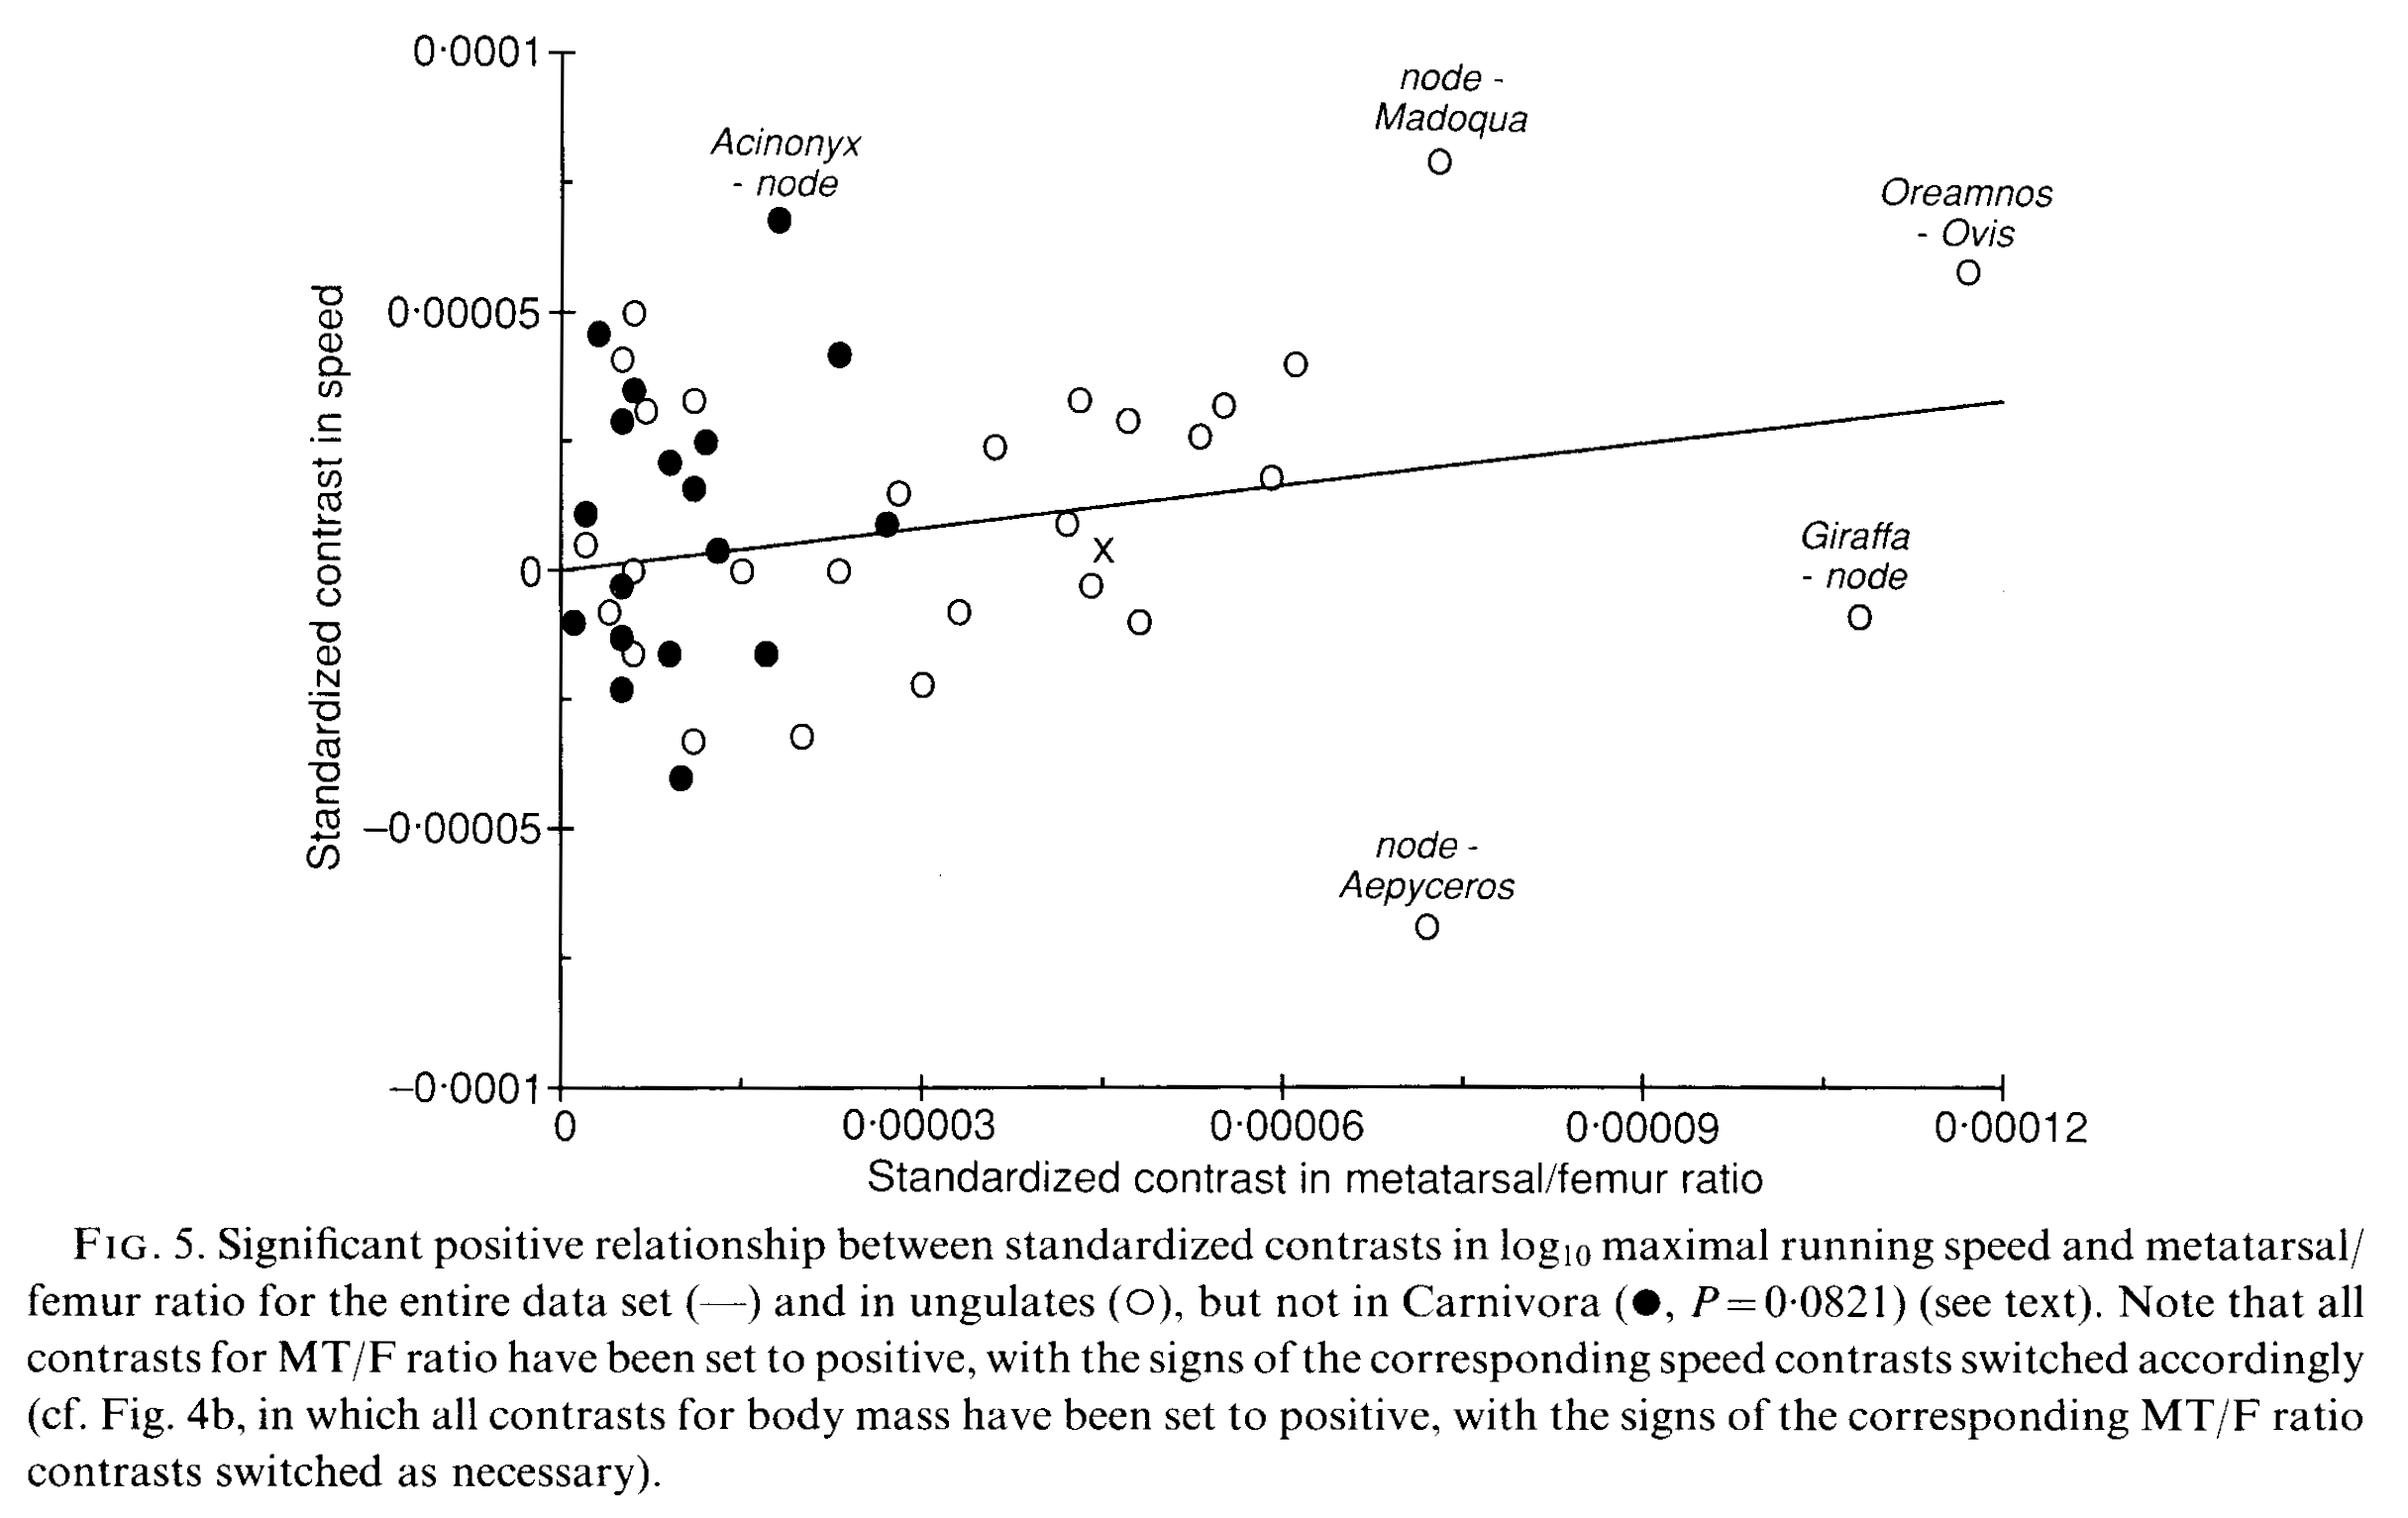
Above, Garland and Janis 1993 (link to pdf here) examined how the ratio of metatarsal (“sole bones” of the lower end of the leg/foot) vs. femur (thigh bone) length relate to speed, with evolutionary relationships taken into account. The methods (“independent contrasts” and its conceptual kin; I won’t delve into that morass more here!) did not exist for looking at phylogeny’s effects on the results in Garland’s 1983 paper. Yet “cursoriality” (relative elongation of the lower limb) had been thought to relate to running speed for over 80 years at that time, so that was what they tested: how much does limb-elongation correlate in a positive way with maximal running speed? They found that the answer was “sort of”, but that other things like home range size, energetics, ecology, etc. might explain as much/more, so caveat emptor. And by looking at the plot above, it’s evident that there’s a lot of specialization (scatter, along the x and/or y axes– check out the giraffe/Giraffa and cheetah/Acinonyx outliers, for example). While ungulates seemed to have a better relationship of speed and limb dimensions, their predatory carnivoran relatives did not.Christiansen 2002- max speed

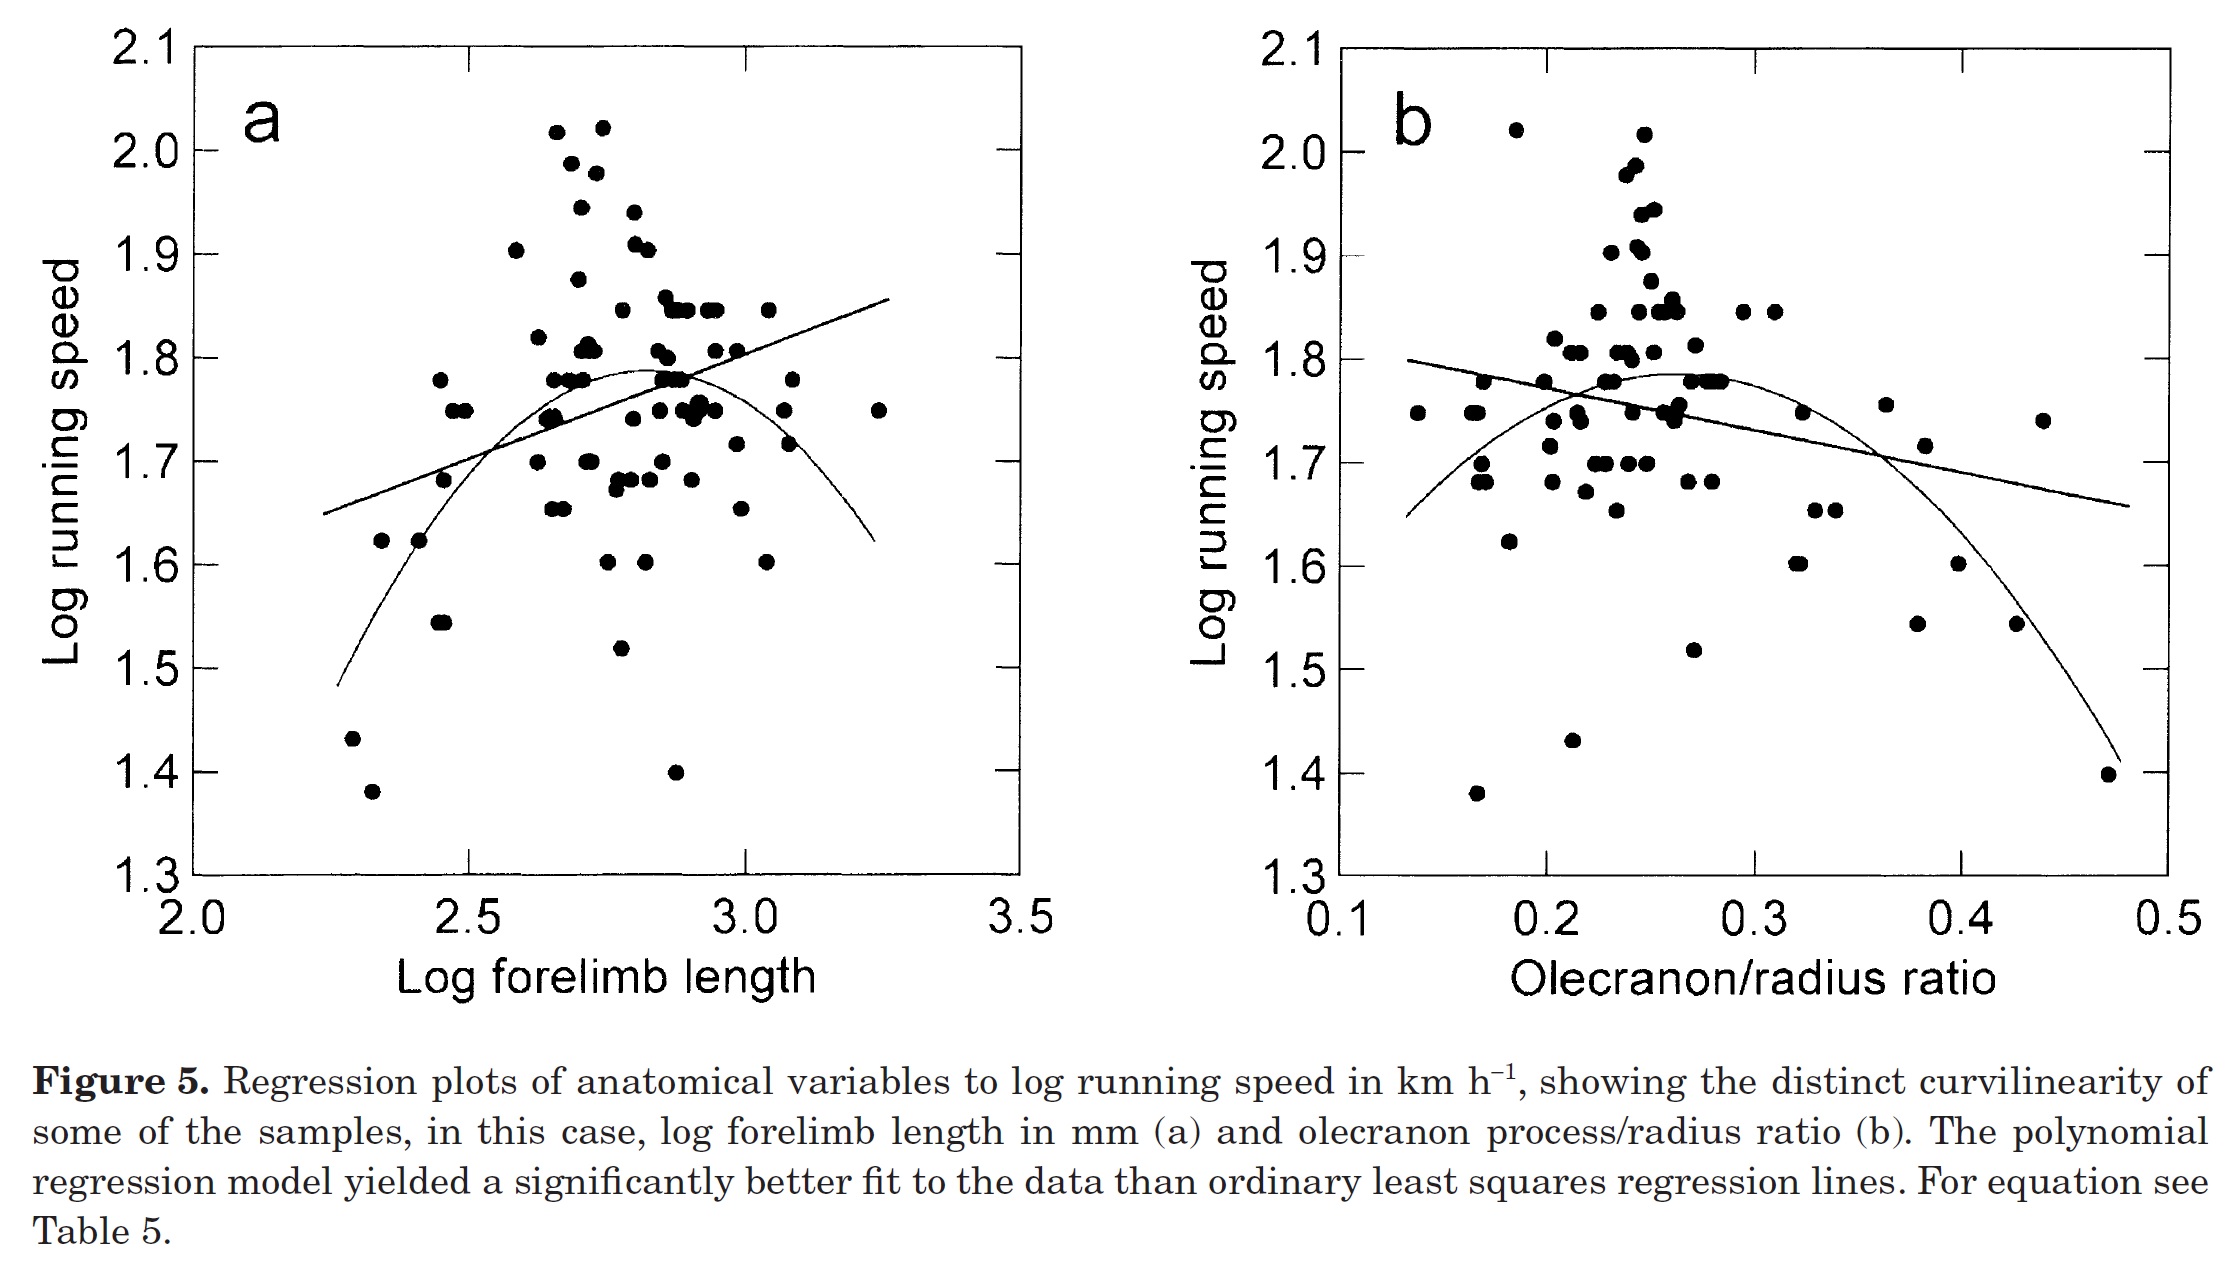
Christiansen was one of two studies in 2002 that looked back on those Garland 1983 data in a new way, and like the 1993 study with Janis considered these data in light of limb lengths too.  The plot above delved into how running speed changes with lengths of forelimb bones, again finding appreciable curvilinearity (indirectly supporting the non-linear scaling idea– even at large sizes, relatively longer-legged mammals aren’t faster). The plot on the right side (b) measured the relative length of the olecranon process; the “funny bone” that acts as a lever for support of the elbow joint against gravity. Again, even mammals that have stouter elbow-supporting processes aren’t faster; there’s a “happy medium” of elbow-osity for optimizing running speed (and huge scatter in the data!). Ultimately, this analysis concluded that it wasn’t speed that animal anatomy seemed to be optimizing overall, especially as size increased, but rather energetic cost, although there was a lot of variation in the data and accounting for phylogeny only muddled things up more (as it tends to do).

diaz2002

Iriarte-Diaz was the other 2002 study to tackle the speed-vs-size issue. It focused primarily on whether mammal speeds showed “differential” (i.e. non-linear) scaling with size, as per the polynomial regression in Garland’s 1983 study. It showed that smaller mammals seemed to either get slightly slower with increasing size or else not change maximal speed (depending on detailed methods/data stuff that don’t matter here), whereas bigger mammals exhibited very strong declines of speed with size past a threshold (optimal) body mass.

So, repeated analyses of Garland’s 1983 data (and modifications of those data) at least uphold the fundamental conclusion that big land mammals cannot move quickly, in an absolute sense (meters/sec or kph or mph) — and much more so in a relative sense (e.g. body lengths/second or other normalized metrics). We might then ask why, and my research scrutinizes this issue in terms of the fundamental mechanisms of movement biomechanics and anatomy that might help to explain why, but for brevity I won’t go there in this post. I want to wander elsewhere.

I want to wander back to those data used in the above (and other) studies. All of the studies discuss the quality of the data and bemoan the lack of quality. I’d agree with them that it’s hard to imagine most of the data being consistently off in a biased way that would fundamentally alter their conclusions. But I still worry. We should worry about the data points for the extreme animals- the fastest, slowest, largest and smallest. We should worry about subjectively removing “outliers” such as hippos or cheetahs, as they do change some of the results.

I worry about elephants, for example: my work has shown that they can “run” about 7 meters/second or ~25 kph; not the 35 kph used as data for African elephants (from speedometer-y anecdotal estimates)– ~1.4 times the speed we’ve been able to measure for both species. See this old “blog post” (sort of) for more information on the tortuous history of characterizing elephant speeds and gaits. And are a white rhino and hippo able to run at this same 25 kph speed as the original data in the 1983 study state, or faster/slower? No one has really nicely measured this so we can’t be sure, but I can imagine it being off by a similar 40% or so. On the other hand, if the bigger animals in the dataset are slower than the original data, that actually strengthens the conclusion that bigger animals are slower, so who cares that much, in the grand scheme of things?

We could worry about plenty of other maximal speed data points, and the “average” adult body masses assumed (although I doubt those would change the results as much as the speed errors). Maybe another question is, in doing such broad-scale analyses should we only include data points that have maximal precision (e.g. elephants, horses, cheetahs, greyhounds, humans and a few others)? We’d maybe be able to do a study of 20 or so species. I doubt it would show much that is different if we did, although I expect that sample size and noise would begin to dampen out the signal. See below.

However, a double standard begins to become evident here. In modern biomechanics (and probably the rest of biology/science), there’s a strong emphasis on data quality and technologically precise measurement. Garland’s 1983 study might be hard to get past peer review today (or maybe not). We agonize over single-species studies trying hard to measure animals’ maximal speeds (a very hard thing to be sure of in terms of motivation, but not intractable unless one takes an almost antiscientific/overly cynical view that animals could always be holding back some critical reserve unless they run for their lives– is that reserve 1%, 10% or 100%? Probably closer to the middle, in good studies). We measure multiple animals and many trials, in field and/or lab conditions, with documented video footage at high resolution and frame rate, with GPS tracking or other tools to maximize precision. We take pride in these high standards today. That’s what makes scientists wriggle uncomfortably when we look back at the data in those older maximal speed papers and ponder how few data points are verified, documented, precise and essentially trustworthy.

So should broad studies be working by the same standards as narrow studies? (I’m far, far, far from the first scientist to think about this but it’s interesting for me at least to think about it in this case and others) There is potential tension here between empiricists who want precise data and theoreticians who want to tackle those Big Questions, and that’s a pattern one can see throughout much of science. I sit on the fence myself, doing both approaches. I can think of plenty of similar examples, in “big data” palaeobiology, morphometrics, genomics, physics and so on. Some of those fields have nice databases with quality control over the data; they’ve maybe solved this problem to a large degree. This tiny area of mammalian maximal speeds hasn’t solved it, but how urgent is the need to?

On the flip side, even if the data points have some error of 10-20% or even 40% that error will probably be largely random, not biased toward assuming that bigger or smaller animals are slower than they truly are, or medium-sized animals faster. We still have the reliable cheetah data point (and racehorses, and greyhounds) showing >100 kph (and 70 kph) speeds for ~100 (and ~40, 400ish) kg animals, so there is evidence for a peak of maximal speed (the cheetah outlier, and one might also throw in pronghorn antelope or others that are pretty damn fast but not yet well measured) at medium body size. I expect there would be incremental overall progress if we did improve the data quality, and that would still be nice (comforting!) but it would be a tough, tough slog. Indeed, my team is doing its share of that, already tackling the data point for giraffes this year (stay tuned!). The potential gains are still there, especially for understanding the unique biology of individual species– that noise in the data (or specialization, if you prefer) is interesting!!! We need that kind of work, partly because the big questions, sexy as they are, still depend on having data quality as a foundation, and old questions still need revisiting from time to time as data quality is improved by those in the trenches of gathering it.

My team’s journal club has gone over the Garland paper lately and we’re hitting the others later this summer, but I wanted to throw these thoughts out there on this blog now to see if they generated any fun discussion, or they might introduce others to the science of maximal speeds and what we do/don’t know. One thing we don’t know much about is what kinds of patterns non-mammalian groups exhibit today. Chris Clemente did some great work on this with lizards, finding a pattern similar to the mammal one. I’ve struggled in my work to move toward trying to address similar questions for extinct groups, but there the data quality presents a challenge I find exciting rather than depressing, although I still have to shrug when I see limb lengths or proportions being used as a proxy for speed. We can do better.

So I’d love to hear your thoughts on any of the points here. Maybe some of the old-timers have stories from ye olden days when Garland’s work was originally published; I’d love to hear those, or other points/questions/favourite papers.

I was inspired this week, after a stimulating conference, to put into writing what my team stands for. What do we have in common with other scientists, or what makes us different, or what should we all be doing together beyond the actual science itself? I’ve written advice for my team before, but not something like this, and with new staff/students coming soon, I want something ready for them to see what we’re about, and what we need to become more of, too. Not a rant, but a calm codification of our core beliefs. I presented this to my team later in the week for edits and ideas, and felt that it’s now ready for sharing. There’s no reason to keep it private; I personally like what’s here at the moment, and response from my team was positive, too. I am sure opinions will vary, and it’s my team to lead so I might not agree with some, but the fact that I’m posting this means that I expect it’s quite likely that this “mission statement” will improve if commenters pipe up.

No images this time, except for Jerry above. I want the emphasis to be on the thoughts.

Stomach-Churning Rating: wot? No, not that kind of post.

Here we outline my team’s fundamental principles and ethos for our scientific activities, beyond the rules of the RVC and other institutions (e.g. funders) that we adhere to, and basic common sense or morality, or elaborating on and emphasizing those in relation to our work. This is a document that will evolve as we learn from our experiences. We welcome input and discussion. It applies to all of Team Hutch’s staff and students (and Prof. John Hutchinson [JRH], too). The intent is positive: to remind us of our overarching scientific standards, to foster lively debate and to educate ourselves by challenging us to think about what we stand for. The motivation is to communicate the team’s ethos, benefiting from past lessons. The application is flexible, to accommodate the fact that everyone is different, although some of our ethos must be rigid.

While we are unified by research interests, we respect and value other aspects of science including teaching and administrative work. We consider science communication and public engagement to be part of research, too. Our focus is on the evolution of locomotor biomechanics in organisms and, to maintain a strength in this focus, we try to remain within it. However, “side projects” are enthusiastically supported as long as the main research foci of projects (including past work) remain the top priorities and on target.

We aim to conduct high quality research (and other scientific efforts), where possible setting and following gold standards, and acting in a professional leadership role. We are willing to slow our research progress in order to improve the quality of the work, although we also recognize that science is an imperfect human venture. “Minimal publishable units” are not a goal of our research but we fully recognize that early career scientists need to publish in order to move on in many careers.

We are scholars- we care deeply about communicating with each other, our colleagues, and the past and future of science via the literature. We try to keep up with progress in our fields. This is normal practice but we try to do even better than normal. We aim to publish all research we do; otherwise it is wasted effort.

We also treasure openness in science, from publishing our work in open access formats where feasible, to externally sharing open data and methods with the broader community and public, as quickly and comprehensively as possible.

Regular communication within the team and with collaborators is immensely valuable and so we respond promptly to it (sensibly—working or communicating out of normal working hours is not expected!). We participate in regular lab meetings as part of the team culture and communication. In socializing within and outside the team, we respect others, attempting to avoid offense caused by demeaning or other behaviour. Our team members should not be condescended to in discussions or otherwise made to feel stupid- speaking out should be cultivated, not repressed with aggression or egotism.

Quality of writing (and other communication such as oral presentations) in science is something that we aim to maximize, improving our own writing skills and products by pushing ourselves to learn to be better and by constructive critiques of others’ writing.

Ethical practice in all of our work is immensely valued. This includes diversity of people and skills, which broaden our perspectives and help us to transcend disciplinary boundaries that might otherwise blind us to broader insights. We are a team- we support each other in our work and careers, trying to eschew internal competition or territoriality. Mutual benefits from teamwork need to be raised above selfish individualism; focusing on one person’s need for career boosts may reduce others’ prospects.

One of the most treasured ethical principles that we cleave to is integrity. Among the worst scientific crimes that can be committed are fraud, intellectual property theft and plagiarism—no goal justifies those actions. We seek to be our own toughest critics, within reason, to minimize errors or worse outcomes in our science. We promptly correct our published research if we find errors needing amendment.

Ethical sourcing of and handling of data or specimens is important to us. Whether it is favouring publically accessible as opposed to privately held fossil (or other) specimens or cadaveric material that was obtained via traceable sources that maintain legal or optimal standards of animal welfare, we target the “high road” in obtaining material for study. If we conduct in vivo animal research we attempt to transcend the standards of the “three R’s” and set a high example, maximizing animal welfare and benefits from that research—as we are at a veterinary university, we involve vets and other health and welfare specialists in transferring knowledge from our work to improving the lives of animals.

We try to be inclusive in coauthorship of publications (following RVC rules) but especially do not tolerate “honorary coauthors” who contribute little or nothing to research. We value idea production, data collection and provision, analysis, writing and revision as ingredients that earn coauthorship.

[these next two paragraphs still feel too formal/negative to me, but they highlight something important that I’ve learned about; to a degree there must be hierarchy, and I’m the only one that will be in Team Hutch for as long as it lasts, so I have to be the enforcer of its long-term rules. It’s the aspect of this job that I probably enjoy least, but it looms there whether I like it or not.]

As per RVC intellectual property (IP) rules (as well as rules of funders etc.), all IP generated while working at the RVC remains its IP, managed by JRH. Such IP can and should be used by those generating it, and others that would benefit (including those who have since left the lab) but to ensure proper conduct, JRH must approve usage.

JRH is the leader of the team and as manager has final say in decisions, but encourages negotiation and reasonable disagreement to seek mutually acceptable solutions. JRH makes mistakes too and welcomes them being pointed out. JRH seeks to help his team succeed in whatever career goals they have and for long after they depart Team Hutch, but expects solid effort at work in return, and dedication to the principles outlined here.

We are human. We want fun, enjoyable lives including at work, and this pursuit of fun colours all that we do, because science is fun and so are scientists. We want that fun to radiate upon the world and echo through time.

=====

That’s as it stands right now. What do you think? I am certain that I have left things out, but it’s a start.

Sorry about the title. It’s the best I could do. In case you missed it on our Anatomy to You blog, we unleashed a hefty database of CT (and some MRI) scans of our frozen crocodile cadavers last week, for free public usage. In total, it’s about 34 individuals from 5 species, in 53 databases constituting around 26,000 individual DICOM file format slices of data. This page has a table of what the data/specimens are. I am writing this post to share some more images and ensure that word gets out. We’re thrilled to be able to finally release this first dataset. We have plans to let loose a LOT more such data in the future, for various organisms that we study.

Stomach-Churning Rating: 2/10- be glad that these data don’t come with an olfactory component, especially the five rotten, maggot-ridden Morelet’s croc specimens, which are among the stinkiest things I’ve dealt with.

Crocodiles are no strangers to this blog, of course, as these past links testify. Indeed, most of the crocodile images I’ve blogged with come from specimens that are in this scan dataset. We even released a “celebrity crocodile, “WCROC” or FNC7 in our dataset, which is the 3.7m long Nile croc from “Inside Nature’s Giants”. It broke our CT scanner back in ~2009 but we got the data, except for the torso, and we also got some MRI scans from it, so we’re chuffed.

Above: The only spectacled caiman (Caiman crocodilus); and indeed the only alligatorid; in our dataset. To watch for: stomach contents/gastroliths, and all the damn osteoderms that I did/didn’t segment in this quickly processed file. This specimen had its limbs dissected for one of our studies, so only the right limbs are visible.

There are some more specimens to come- e.g. five baby Nile crocs‘ datasets (“GNC1-5”) are hiding somewhere in our drives and we just need to dig them up. You might also know that we published some scan data for crocodile vertebral columns (including fossils) in our recent paper with Julia Molnar et al. (and related biomechanical data discussed here), and we published all of our anatomical measurements for a huge set of crocodylian species in our papers by Vivian Allen et al. And then I had an enjoyable collaboration with Colleen Farmer and Emma Schachner on the lung anatomy of various crocodylian species, using these same specimens and related scan datasets.


Above: rotating Crocodylus moreletii (specimen FMC5 from our database) in a happy colour.

Sharing these kind of huge datasets isn’t so easy. Not only do few websites host them cheaply, and with reasonable file size limits, and limited headaches for what info you have to provide, and with some confidence that the websites/databases will still exist in 5-20 years, but also we were hesitant to release the dataset until we felt that it was nicely curated. Researchers can now visit my lab and study the skeletons (or in some cases, the still-frozen specimens) matched up with the scan data, and known body masses or other metadata. We’re not a museum with dedicated curatorial staff, so that was not trivial to reliably organize, and I still worry that somewhere in the dataset we mis-identified a specimen or something. But we’ve done our best, and I’m happy with that for now.

Above: rotating Osteolaemus tetraspis (specimen FDC2 from our database), which was obviously dissected a bit postmortem before we could scan it, but still shows some cool features like the extensive bony armour and the cute little doglike (to me, anyway) skull. I worked with these animals (live) a bit >10 years ago and came to love them. Compared to some other crocodiles we worked with, they had a pleasant demeanour. Like this guy:

Osteolaemus (resting) set up with motion capture markers for a yet-to-be-published study that we did in 2005 (ugh!). It wasn't harmed by this.

Osteolaemus (resting) set up with motion capture markers for a yet-to-be-published gait study that we did in 2005 (ugh!). It wasn’t harmed by this.

Anyway, as a person who likes to maintain quality in the science we do, I also was hesitant to “just” release the DICOM file data rather than beautiful segmented 3D skeletal (or other tissue) geometry that is ready for 3D printing or animation or other uses, or interactive online tools like Sketchfab. Other labs (e.g. Witmerlab) do these kind of things better than we do and they inspire us to raise our game in the future, but I am sure that we will be forgiven for releasing big datasets without gorgeous visuals and more practical, processed files — this time. 🙂  We agree with many other scientists that sharing data is part of modern, responsible science– and it can be fun, too! Oddly enough, in this case we hadn’t used the CT/MRI data much for our own studies; most of the scans were never fully digitized. We just scan everything we get and figured it was time to share these scans.

Enjoy. If you do something cool with the data that we’ve made accessible, please let us know so we can spread the joy!

And if you’re a researcher headed to ICVM next week, I hope to see you there!

Who needs “Ice Road Truckers” when you have the “John’s Freezer” team on the road with fossils, amphibians, felids and 3D phenotype fun? No one, that’s who. We’re rocking the Cheltenham Science Festival for our first time (as a group), and pulling out all the stops by presenting two events! Here’s the skinny on them, with updates as the week proceeds.

Stomach-Churning Rating: 2/10 for now (just bones), but it could change once the cheetah dissection is under way… 8/10 bloody cheetah bits but only at the end (updated)

Right now, Lauren Sumner-Rooney (of “Anatomy To You” and other fame) is on-site with a rotating team of others from our lab, in the “Free Activity Tents” area of the Imperial Gardens/Square, inside a marquee where we’ll be showing off our NERC-funded tetrapod research all week. This “First Steps” event features not only our past and present work with Jenny Clack, Stephanie Pierce, Julia Molnar and others on Ichthyostega & its “fishapod” mates, but also our “scampering salamanders” research in Spain, Germany and England. I’ve blogged a lot about all that, and won’t repeat it here, but you can see a 3D-printed Ichthyostega skeleton, view the skeleton in a virtual reality 3D environment, see related specimens and engage in kid-friendly activities, and talk to our team about this and other related research.

Ichthyostega 3D printed backbone is born!

Ichthyostega 3D printed backbone is born!

The central themes of that event are how bone structure relates to function and how we can use such information, along with experimental measurements and computer models of real salamanders, to reconstruct how extinct animals might have behaved as well as how swimming animals became walking ones. How did fins transform into limbs and what did that mean for how vertebrates made the evolutionary transition onto land? If you know my team’s work, that encapsulates our general approach to many other problems in evolutionary biomechanics (e.g. how did avian bipedalism evolve?). Added benefits are that you too can explore this theme in a hands-on way, and you can talk with us about it in person. That continues all week (i.e. until Saturday evening); I’ll be around from Thursday afternoon onwards, too. Kids of all ages are welcome!

Ichthyostega 3D print taking shape!

Ichthyostega 3D print taking shape!

Then, on Saturday for our second free event we join forces with Ben Garrod (master of primate evolution, the secrets of bones, and “Attenborough and the Giant Dinosaur”) and RVC’s forensic pathologist Alexander Stoll as well as Sophie Regnault (“sesamoid street” PhD student w/me). As the “Large Animal Dissection” title hints, it’s not the right kind of gig to bring small kids to. There will be blood and stuff— we’ll be dissecting a cheetah together from 10am-4pm. This will involve walking through all the major organ systems, giving evolutionary anecdotes, and plenty more, with an aim to understand how the magnificent adaptations of cheetahs evolved—but also to investigate what problem(s) this animal faced that led to its sad demise. By the day’s end, there will just be a skeleton left. Get a front row seat early for this event, which serendipitously ties into “Team Cat”’s Leverhulme Trust-funded research project (we wanted a big animal and it just happened to be a cheetah; I had hoped for a giant croc or a shark or something but can’t complain!).

Ichthyostega 3D print is ready!

Ichthyostega 3D print is ready!

If you miss these events, please do cry bitter tears of regret. But don’t despair, there will be another “big cat dissection” in the London area in ~November (watch here for details), and plenty more fossil tetrapod stuff to come, plus a LOT more dinosaurs on the horizon!

Guess the bones! (photo by Zoe Self)

Guess the bones! (photo by Zoe Self)

And please come back to this blog post for more pics and stories as the week carries on… For hashtag afficionados, you can follow the fun on Twitter etc. at #firststepsCSF16. What a world we live in!

Update 1: While you’re here, check out our Youtube playlists of tetrapod-related videos:

Lobe-finned fishes

Ichthyostega‘s awesome anatomy

Tetrapod evolution: Tiktaalik to salamanders!

Update 2: Photos of our main stand (about tetrapod evolution)

csf2016-display

Our poster/banner display looks nice.

20160609_143548

Our tent brings in some punters.

20160609_151508

Our bones excite people young and old, sighted and blind.

20160610_090009

Fun with stickers and lab t-shirts.

And…

Update 3: Cheetah meat & greet
Ben, Alex, Sophie and I tackled the cheetah dissection today and it went GREAT! Much better than I’d optimistically expected. Rain didn’t scare the crowds off and neither did the gore, which there was some of (gelatinous spinal cords, lumpy tumors and at least one flying tiny bit of cheetah flesh that landed on a good-natured audience member!). Photos will tell the tale:

20160611_091345

Peek-a-boo!

20160611_093828

Sophie and Alex help us get set up in our tent.

20160611_094554

Our initial rough schedule- although we ended up improvising more after lunch.

20160611_095500

Dissectors assemble!

20160611_105126

The beast revealed. It was skinned by the museum that loaned it to us.

20160611_110748

Alex showing his talent: removing the viscera in one piece from end to end, starting with the tongue.

20160611_153148

Impressive finding of a surgical fixture (plate and wires) on the tibia, which had been used to hold the shattered bone back together long enough for it to heal. Added to the kidney disease and liver-spleen-lung cancer, this cheetah was in the sorriest shape of any cadaver I’ve seen yet.

20160611_153213

Cheetah coming to pieces: (from bottom) lumbar/pelvic region, hindlimb, thorax, forelimb and other bits.

20160611_155452

Dr Adam Rutherford, an eye expert, did a nice dissection of the cheetah’s eye, here showing the tapetum lucidum (reflective membrane), which shows up as light blue colour. Its small size befits the not-very-nocturnal habits of cheetahs.

20160611_155459

The lens of the cheetah’s eye. Now cloudy because of dehydration and crystalization, but still fascinating to see.

Want to see more images and the enthusiastic responses from the audience (we got some great feedback)? Check out Twitter’s #cheltscifest feed, or more simply my Storify condensation of the cheetah-related tweets here.

I hadn’t been feeling very well for several weeks and then last night it happened. This post is a description of what it’s like to be an epileptic, written simply to document my experience. My goal here is to do that, almost in a dispassionate scientific way, and if it helps others going through similar experiences — feedback I often receive from such posts — that’s wonderful. My post is not a call for sympathy or help, although those are understandable and kind responses, and it’s not a complaint either. It just is, because what I am is what it is.

I’ve realized that my blog has become about not just documenting how amazing, freakish and immensely fallible that anatomy can be in other species, but also about my own experiences with my anatomy (and physiology) failing, as per these two prior posts about my shoulder and brain (more links therein). Sharing these experiences gives me strength and clarity, even if some of that emerges from partly detaching myself from the emotional nature of the experience and trying to look at it from outside of myself. I can be a private person, so feeling like I can discuss something uncomfortable and vulnerable makes me feel like I am growing, much as I innately resist that.

Stomach-Churning Rating: 1/10; no fun events described, but no images either.

I’ve had enough experience now as an epileptic that I look back on my seizures with disappointment (“Oh damn, not again.”) but also familiarity (“OK that happened; I know how things will go now.”). They are terrifying at the time, especially for my family, and my disorientation when emerging from unconsciousness with strangers around and with a gap in my memory is nightmarish.

I was watching a documentary about the Jutland battle in WWI while my daughter was put to bed. Then… I woke up, maybe 20 minutes later, unsure what was going on. There were two “first responders” (emergency non-paramedics) present, one of whom I eventually recognized from my prior emergency experiences in recent months, trying to talk to me with my wife. I was impressed to later hear that they’d come within 5 minutes of being called; not bad for life in a small English town. I came to realize that my right shoulder hurt again (from violent spasms), reducing it to almost a one-degree-of-freedom joint (mostly able to move fore and aft; almost zero pronation/supination without intense pain), reminscent of Ichthyostega‘s. I was surrounded by tissues wet with blood from my lip, where I’d again bitten myself during my fit. I could sense my racing heartbeat and fluctuating temperature, other hallmarks of my pre- and post-seizure symptoms. My vision was blurry, with my eyes usually becoming dilated during a seizure.

But the predominant feeling that takes an uncomfortably long time to pass is the “post-ictal state“, a mind clouded by confusion, slowly becoming aware that my neurons are misfiring but are beginning to sort themselves out. I sometimes irrationally want to just go back to sleep and not talk, and need some rational insistence from carers that we can’t do that right now. It is this vacillation between consciousness and unconsciousness, in a grey area in between, that I find most disturbing, as I cannot completely trust my own mind, disbelieving what is happening (“Is this real?”), and sometimes I lapse back into seizure(s) again. This is a powerful example of the frightfulness of uncertainty. As a scientist, so reliant on my mind, it is horrifying to feel like it is out of control. It also conjures up memories of observing my mother’s mind declining with Alzheimer’s syndrome, and those are vastly painful.

As I became able to put words together semi-coherently, and as the medics poked and prodded me to do tests on my symptoms (I had a cannula in my left arm’s blood vessel by now), discussion turned to whether to take me to the hospital once the paramedics arrived with the ambulance. In the past, there was no question of the need for a trip to Accident & Emergency (A&E in the UK; same as the ER in the USA).

Yet now, with almost 2 years of experiences behind me, I (and my carers) have come to know my better seizures from my worst ones. And given that A&E normally involves >4 hours of lying around in a noisy room, constantly disturbed by checkups or screaming patients, it is far from restful and rest is what I tend to need most. After an hour of vigilance, my symptoms faded and I became more able to answer queries, even to talk over options. We agreed that I could stay home, try to rest, and go to A&E if I had another seizure.

I am glad to say that I got a full night of rest and I feel a lot better today. That I am able to think clearly enough to write this post gives me reassurance. After past seizures, I’d often be unable to do much except take naps and gawk slack-jawed at the TV screen, with my vision still blurred (one eye even seemed to change shape post-seizure once, and I began seeing things in the corner of my field of view that are not truly there). So the bright side of this post is, maybe my medications are working better now, and maybe we will get this epilepsy under control, but I keep saying that every 2-3 months and then being proven wrong by another seizure, so a lot of uncertainty looms.

Nonetheless, seizures involve a “refractory period” that makes further seizures less likely for some time period, so odds are good that I can feel more secure while I recover from this event, which usually takes two weeks or so to get my brain feeling closer to “normal”. Even so, my mind remains clouded by these post-ictal feelings, weighting me down with fatigue that is the most chronic challenge I struggle against now as an epileptic. It leaves me unable to do as much as I once could, with a backlog of work growing behind me like never before. This is the “diminishing” that I lamented before; it is not just old age.

That’s what one experience was like for me, and I’m glad that it was far from the worst “neural storms” I’ve suffered. I hope that readers find it interesting. Now that my battle is over for now, I’ll take some time to find out how that Jutland battle turned out.

Last year we finally, after about 14 years of slow work, released our biomechanical model of an ostrich’s hindleg. We showed how it informed us about the potential leverages (moment arms; contributions to mechanical advantage of the joints) of all of the muscles. It was a satisfying moment, to understate it, to finally publish this work from my postdoc at Stanford. Today, we begin to deliver on that model’s promise. And it only took 4 years or so, roughly? The journal Royal Society Interface has published our study of how we used this musculoskeletal model to simulate walking and running dynamics. Those simulations join an intimidatingly broad and complex literature using similar models to study human (and some other primate) locomotion or other functions at the level of individual muscles (for whole limbs/bodies) in vast detail and growing rigor. I have Dr. Jeffery Rankin, a research fellow finishing up his post with me after ~6 years of hard work on many projects, to thank for driving this work forward, and Dr. Jonas Rubenson (now at PennState) for his patient collaboration that has continued since the early 2000’s.

Stomach-Churning Rating: 2/10; computer models of muscle actions. The underlying anatomical data are goopy, as prior ostrich-dissection-focused posts show!

Our model; in right side view (on the left) and frontal view (on the right), with muscles in red and the leg's force as the blue arrow; frozen at the middle of a step.

Our model; in right side view (on the left) and frontal view (on the right), with muscles in red and the leg’s force as the blue arrow; frozen at the middle of a running step.

Simulations like these predict things that we can’t easily measure in living animals, such as how much force muscles and tendons generate, how quickly those tissues change length, how much mechanical energy they thus contribute to the joints, limbs and whole body, how much metabolic energy their actions cost, and much more. There are more ways to use these tools than I have space or time to explain, but simply put we forced our ostrich simulation to match experimental measurements of the motions and forces of a representative walking and running ostrich stride, from contact of one foot until the next time that foot hit the ground. It then used optimization methods (minimizing target criteria like muscle stress) to estimate how the muscles and tendons were used to generate those motions and forces. This is a ways ahead of some prior ostrich simulations such as this one that I recall from classes during my PhD studies.

Any modeller worth their salt knows that their models and simulations are wrong at some level. This is much as most science is “wrong”; i.e. a simplification of reality with some errors/noise introduced by assumptions, variation, methods and such. But generally these kinds of musculoskeletal dynamic simulations hold up pretty well against experimental data. A standard “validation” is to test how closely the simulations’ predictions of muscle activity match the “real” (measured in life, also with some uncertain error) activity of muscles. Science still lacks those data for ostriches, but fortunately measurements from other birds (by Steve Gatesy and colleagues) indicate that muscles tend to follow fairly conservative patterns. Grossly speaking, avian leg muscles tend to either be active mainly when the foot is on the ground (stance phase) or off the ground (swing phase). Some studies acknowledge that this is an oversimplification and other muscles do act across those two phases of a stride, either in multiple pulses or as “transitional” (stance-to-swing or swing-to-stance) switch-hitters in their activations. Our ostrich predictions matched the qualitative patterns for avian muscle activations measured to date, so that’s good. The results also reinforced the notion of transitional or multi-phasic muscle activation as still having some importance, which bears more study.

Yet what did the simulations with our ostrich model tell us that other ostrich experiments or other bird species didn’t? Three main things. First, we could calculate what the primary functions of muscles were; they can act as motors (generating energy), brakes (absorbing energy), springs (bouncing energy back and forth) or struts (just transmitting force). We could then sum up what whole muscle groups were doing overall. The image below shows how these broad functions of groups vary across the stance phase (swing phase is harder to condense here so I’ve left it out).

Positive work can speed things up; negative work can slow things down.

Positive work can speed things up; negative work can slow things down. Solid bars are running; striped bars are walking. (from our Fig. 13) You may need to click to em-broaden this image for the gory biomechanical details.

There’s a lot going on there but a few highlights from that plot are that the hip extensor (antigravity) muscles (biarticular hip/knee “hamstrings”) are acting like motors, the knee extensors (like our quadriceps) are mainly braking as in other animals and the ankle is fairly springy as its tendons (e.g. digital flexors; gastrocnemius) suggest. We often characterize birds as “knee-driven” but it’s more accurate biomechanically to say that their hips drive (power; i.e. act as motors) their motion, whereas their knees still act as brakes — in both cases as in many other land vertebrates. Thus in some ways bird legs don’t work so unusually. Birds like ostriches are, though, a little odd in how much they rely on their hamstring muscles to power locomotion (at the hip) rather than their caudofemoral muscles, which are reduced. Zooming in on some particular muscles such as parts of the hip or knee extensors, the functions sometimes weren’t as predictable as their similar anatomy might suggest. Some muscles had parts that turned on during swing phase and other parts used during stance phase. Neural control and mechanics can produce some unexpected patterns.

Second, we looked at one important methodological issue. Simulations of musculoskeletal dynamics can vary from simple static (assuming each instant of a motion is independent from the others; e.g. ignoring acceleration, inertia, tendon effects, etc.) to more complex grades of fully dynamic flavours (e.g. assuming rigid or flexible tendons). We looked across this spectrum of assumptions, for both walking and running gaits, with the expectation that more static assumptions would work less well (vs. more dynamic ones; by various criteria) for running vs. walking. This also showed us how much tendons influence our simulations’ estimates of muscle mechanics—a fully rigid tendon will make the muscle do all of the work (force times length change) whereas a flexible tendon can literally take up some (or even all) of that slack, allowing muscles to remain closer to their isometric (high force-generating, negligible length change) quasi-optimum.

Nicely, our predicted muscle functions weren’t influenced much by these methodological variations. However, static assumptions  clearly were in some ways less appropriate for running than for walking, as were flexible tendons. Somewhat surprisingly, making the simulations more dynamic didn’t lower the levels of activation (and thus presumably the metabolic costs) of muscles, but actually raised those levels. There are good reasons why this might be realistic but it needs further study. It does muddy the waters for the issue of whether assuming that rapid locomotion can be modelled as static is a “bad” thing such as for estimating maximal speeds—yes, tendons can do more (elastic energy storage, etc.) if more dynamic models are used, but co-contraction of antagonistic muscles against each other also brings in some added costs and might lead to slower speed estimates. We’ll see in future work…

Finally, one often overlooked (sometimes even undiscussed!) aspect of these simulations is that they may silently add in extra forces to help muscles that are struggling to support and move their joints. The justification is typically that these extra “reserve actuators” are passive tissues, bony articular forces and other non-muscular interactions. We found that the hip joint muscles of ostriches were very weak at resisting abduction (drawing the thigh away from the body) and this needed resisting during the stance phase, so our simulations had very high reserve actuators switched on there. That fits the anatomy pretty well and needs more investigation.

Want to know more? Happily, not only is the paper free for anyone to view but so are all of the data including the models (modified slightly from our last paper’s). So, although the software (Opensim) isn’t ideal for 4-year-olds to play with (it is fancy engineering stuff), if you have the interest and dilligence it is there to play with and re-use and all that. But also watch this space for future developments, as there is more to happen with our steadily improving models of ostriches and other beasties. Anyway, while this paper is very technical and challenging to explain I am not too bashful to say it’s one of the finer papers from my career; a big stride forward from what we’ve done before. I have been looking forward for a long time to us getting this paper out.

P.S. Our peer reviewers were splendid- tough but constructive and fair. The paper got a lot better thanks to them.