As 2017 approaches its end, there have been a few papers I’ve been involved in that I thought I’d point out here while I have time. Our DAWNDINOS project has been taking up much of that time and you’ll see much more of that project’s work in 2018, but we just published our first paper from it! And since the other two recent papers involve a similar theme of muscles, appendages and computer models of biomechanics, they’ll feature here too.
Stomach-Churning Rating: 0/10; computer models and other abstractions.
Mussaurus patagonicus was an early sauropodomorph dinosaur from Argentina, and is now widely accepted to be a very close relative of the true (giant, quadrupedal) sauropods. Here is John Conway’s great reconstruction of it:

We have been working with Alejandro Otero and Diego Pol on Mussaurus for many years now, starting with Royal Society International Exchange funds and now supported by my ERC grant “DAWNDINOS”. It features in our grant because it is a decent example of a large sauropodomorph that was probably still bipedal and lived near the Triassic-Jurassic transition (~215mya).
In our new study, we applied one of my team’s typical methods, 3D musculoskeletal modelling, to an adult Mussaurus’s forelimbs. This is a change of topic from the hindlimbs that I’ve myopically focused on before with Tyrannosaurus and Velociraptor [in an obscure paper that I should never have published in a book! pdf link], among other critters my team has tackled (mouse, elephant [still to be finished…], ostrich, horse, Ichthyostega… dozens more to come!). But we also modelled the forelimbs of Crocodylus johnstoni (Australian “freshie”) for a key comparison with a living animal whose anatomy we actually knew, rather than reconstructed.

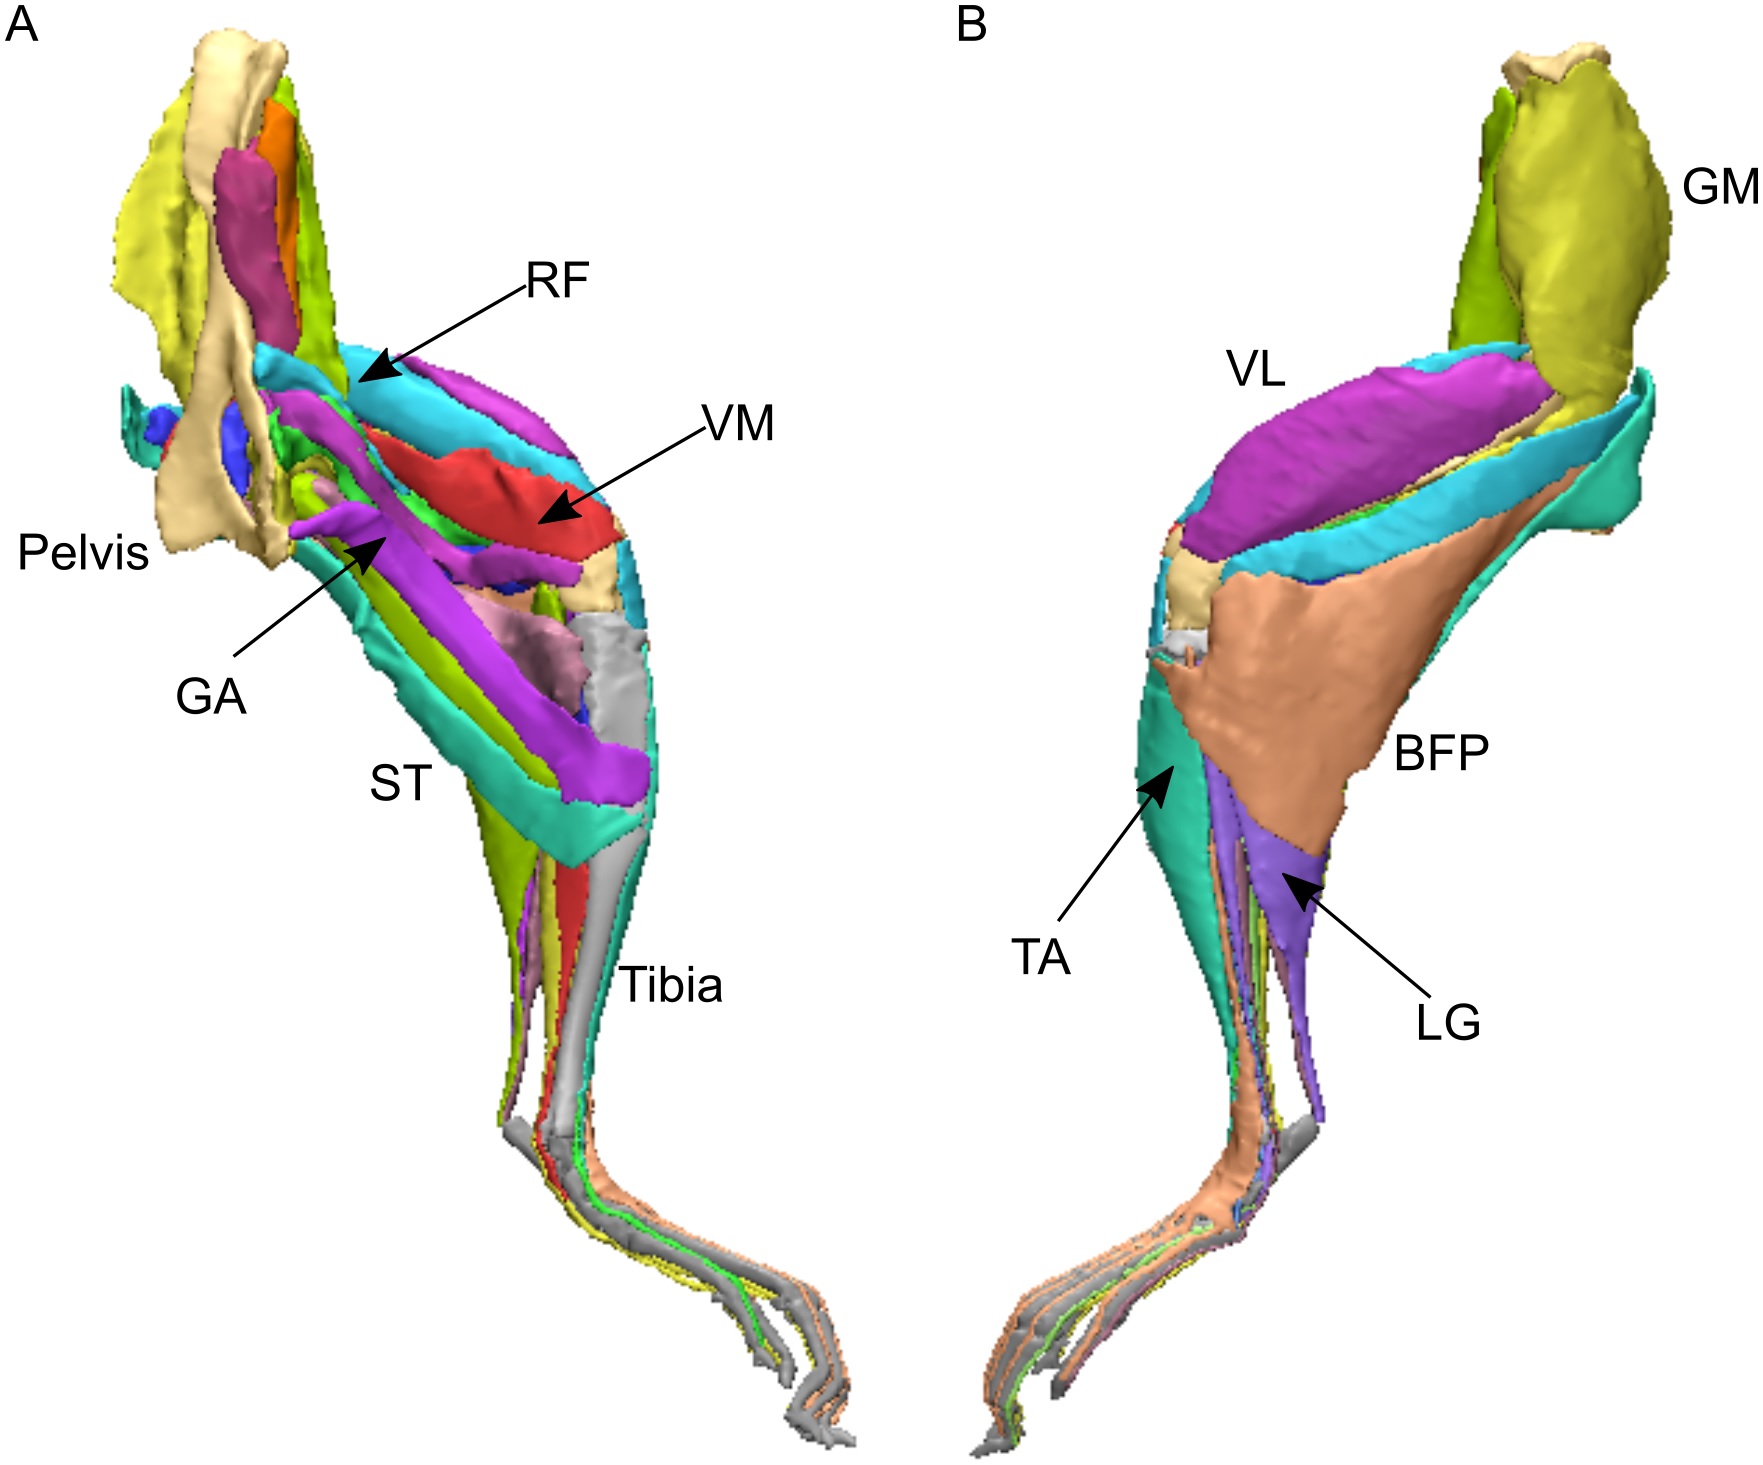
Mussaurus above; Crocodylus below; forelimb models in various views; muscles are red lines.
The methods for this biomechanical modelling are now standard (I learned them from their creator Prof. Scott Delp during my 2001-2003 postdoc at Stanford): scan bones, connect them with joints, add muscle paths around them, and then use the models to estimate joint ranges of motion and muscle moment arms (leverage) around joints. I have some mixed feelings about developing this approach in our 2005 paper that is now widely used by the few teams that study appendicular function in extinct animals. As a recent review paper noted and I’ve always cautioned, it has a lot of assumptions and problems and one must exercise extreme caution in its design and interpretation. Our new Mussaurus paper continues those ruminations, but I think we made some progress, too.
On to the nuts and bolts of the science (it’s a 60 page paper so this summary will omit a lot!): first, we wanted to know how the forelimb joint ranges of motion in Mussaurus compared with those in Crocodylus and whether our model of Mussaurus might be able to be placed in a quadrupedal pose, with the palms at least somewhat flat (“pronated”) on the ground. Even considering missing joint cartilage, this didn’t seem very plausible in Mussaurus unless one allowed the whole forearm to rotate around its long axis from the elbow joint, which is very speculative—but not impossible in Crocodylus, either. Furthermore, the model didn’t seem to have forelimbs fully adapted yet for a more graviportal, columnar posture. Here’s what the model’s mobility was like:
So Mussaurus, like other early sauropodomorphs such as Plateosaurus, probably wasn’t quadrupedal, and thus quadrupedalism must have evolved very close to in the Sauropoda common ancestor.
Second, we compared the muscle moment arms (individual 3D “muscle actions” for short) in different poses for all of the main forelimb muscles that extend (in various ways and extents) from the pectoral girdle to the thumb, for both animals, to see how muscle actions might differ in Crocodylus (which would be closer to the ancestral state) and Mussaurus. Did muscles transform their actions in relation to bipedalism (or reversal to quadrupedalism) in the latter? Well, it’s complicated but there are a lot of similarities and differences in how the muscles might have functioned; probably reflecting evolutionary ancestry and specialization. What I found most surprising about our results was that the forelimbs didn’t have muscles well-positioned to pronate the forearm/hand, and thus musculoskeletal modelling of those muscles reinforced the conclusions from the joints that quadrupedal locomotion was unlikely. I think that result is fairly robust to the uncertainties, but we’ll see in future work.
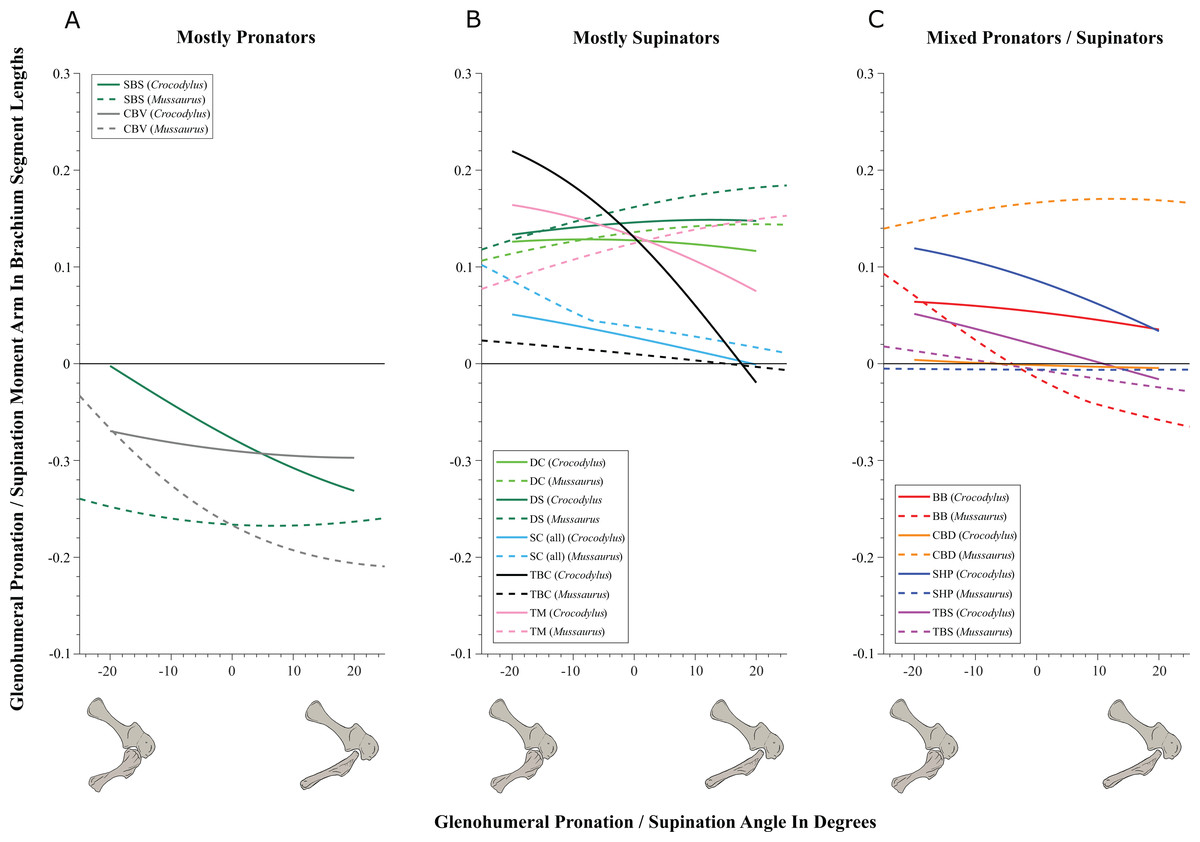
You like moment arms? We got moment arms! 15 figures of them, like this! And tables and explanatory text and comparisons with human data and, well, lots!
If you’re really a myology geek, you might find our other conclusions about individual muscle actions to be interesting—e.g. the scapulohumeralis seems to have been a shoulder pronator in Crocodylus vs. supinator in Mussaurus, owing to differences in humeral shape (specialization present in Mussaurus; which maybe originated in early dinosaurs?). Contrastingly, the deltoid muscles acted in the same basic way in both species; presumed to reflect evolutionary conservation. And muuuuuuch more!
Do you want to know more? You can play with our models (it takes some work in OpenSim free software but it’s do-able) by downloading them (Crocodylus; Mussaurus; also available: Tyrannosaurus, Velociraptor!). And there will be MUCH more about Mussaurus coming soon. What is awesome about this dinosaur is that we have essentially complete skeletons from tiny hatchlings (the “mouse lizard” etymology) to ~1 year old juveniles to >1000kg adults. So we can do more than arm-wave about forelimbs!
But that’s not all. Last week we published our third paper on mouse hindlimb biomechanics, using musculoskeletal modelling as well. This one was a collaboration that arose from past PhD student James Charles’s thesis: his model has been in much demand from mouse researchers, and in this case we were invited by University of Virginia biomechanical engineers to join them in using this model to test how muscle fibres (the truly muscle-y, contractile parts of “muscle-tendon units”) change length in walking mice vs. humans. It was a pleasure to re-unite in coauthorship with Prof. Silvia Blemker, who was a coauthor on that 2005 T. rex hindlimb modelling paper which set me on my current dark path.

Mouse and human legs in right side view, going through walking cycles in simulations. Too small? Click to embiggen.
We found that, because mice move their hindlimb joints through smaller arcs than humans do during walking and because human muscles have large moment arms, the hindlimb muscles of humans change length more—mouse muscles change length only about 48% of the amount that typical leg muscles do in humans! This is cool not only from an evolutionary (mouse muscles are probably closer to the ancestral mammalian state) and scaling (smaller animals may use less muscle excursions, to a point, in comparable gaits?) perspective, but it also has clinical relevance.

Simulated stride for mouse and human; with muscles either almost inactive (Act=0.05) or fully active (Act=1). Red curve goes through much bigger excursions (along y-axis) than blue curve), so humans should use bigger % of their muscle fibre lengths in walking. Too small? Click to embiggen.
My coauthors study muscular dystrophy and similar diseases that can involve muscle stiffness and similar biomechanical or neural control problems. Mice are often used as “models” (both in the sense of analogues/study systems for animal trials in developing treatments, and in the sense of computational abstractions) for human diseases. But because mouse muscles don’t work the same as human muscles, especially in regards to length changes in walking, there are concerns that overreliance on mice as human models might cause erroneous conclusions about what treatments work best to reduce muscle stiffness (or response to muscle stretching that causes progressive damage), for example. Thus either mouse model studies need some rethinking sometimes, or other models such as canines might be more effective. Regardless, it was exciting to be involved in a study that seems to deliver the goods on translating basic science to clinical relevance.

Muscle-by-muscle data; most mouse muscles go through smaller excursions; a few go through greater; some are the same as humans’.
Finally, a third recent paper of ours was led by Julia Molnar and Stephanie Pierce (of prior RVC “Team Tetrapod” affiliation), with myself and Rui Diogo. This study tied together a bunch of disparate research strands of our different teams, including musculature and its homologies, the early tetrapod fossil record, muscle reconstruction in fossils, and biomechanics. And again the focus was on forelimbs, or front-appendages anyway; but turning back the clock to the very early history of fishes, especially lobe-finned forms, and trying to piece together how the few pectoral fin muscles of those fish evolved into the many forelimb muscles of true tetrapods from >400mya to much more recent times.
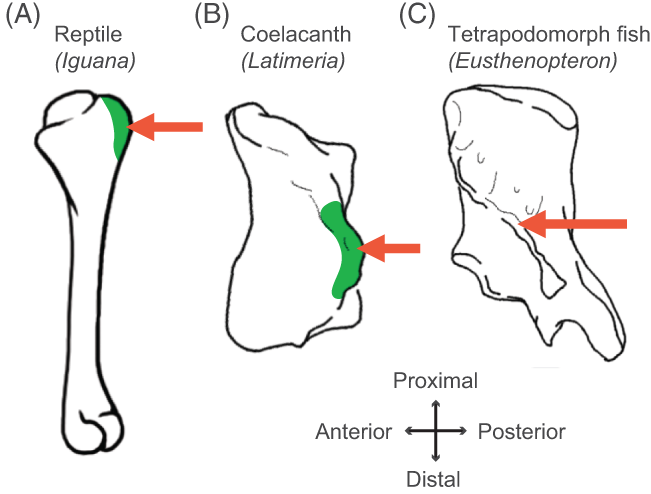
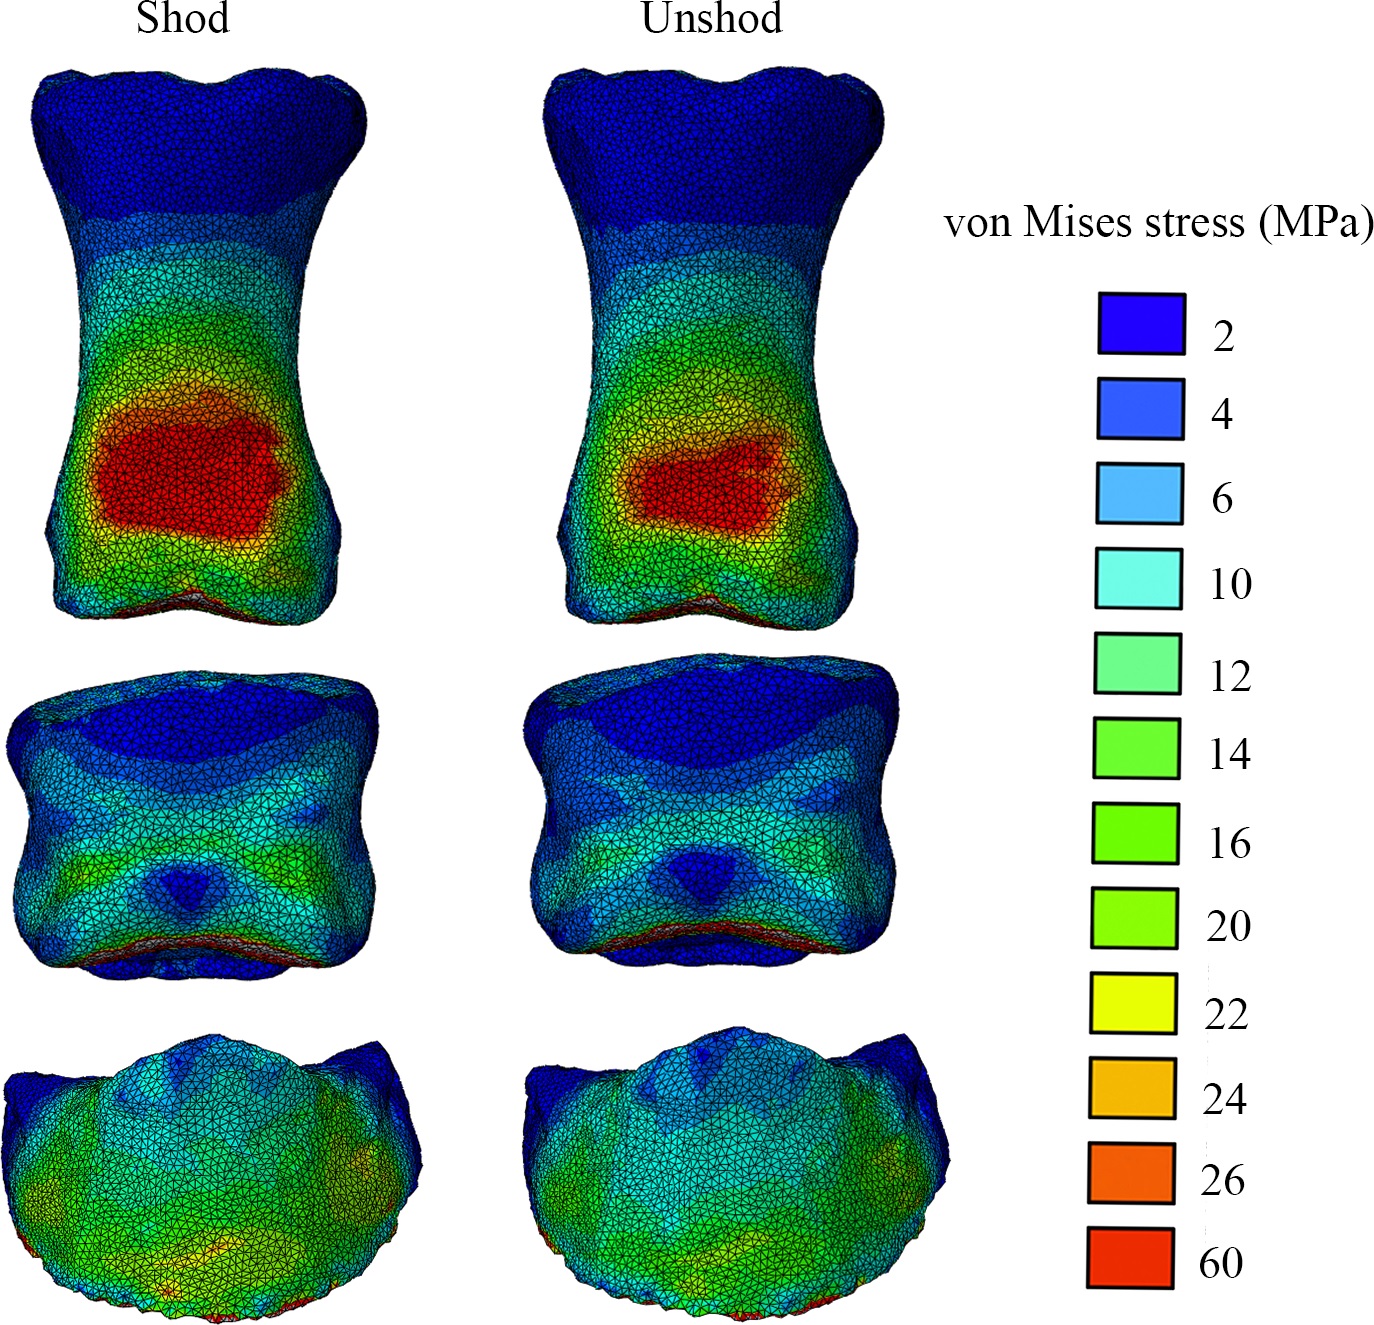
Humerus in ventral view, showing muscle attachments. Extent (green) is unknown in the fossil but the muscle position is clear (arrow).
We considered the homologies for those muscles in extant forms, hypothesized by Diogo, Molnar et al., in light of the fossil record that reveals where those muscles attach(ed), using that reciprocal illumination to reconstruct how forelimb musculature evolved. This parallels almost-as-ancient (well, year 2000) work that I’d done in my PhD on reconstructing hindlimb muscle evolution in early reptiles/archosaurs/dinosaurs/birds. Along the way, we could reconstruct estimates of pectoral muscles in various representative extinct tetrapod(omorph)s.
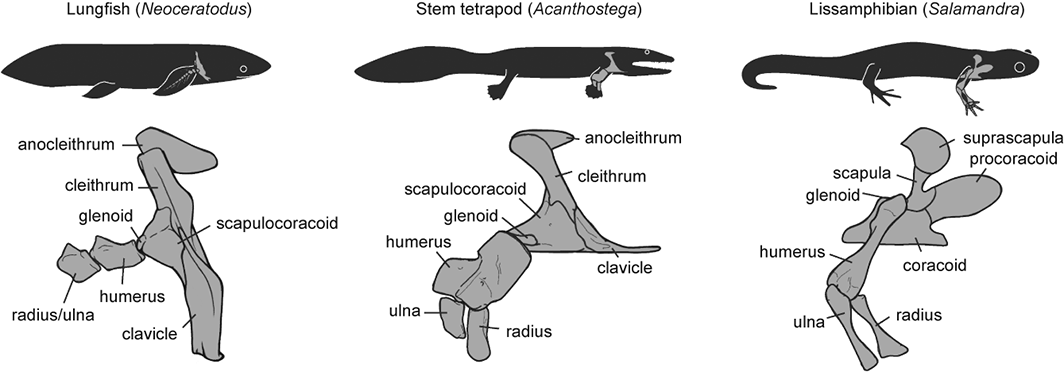
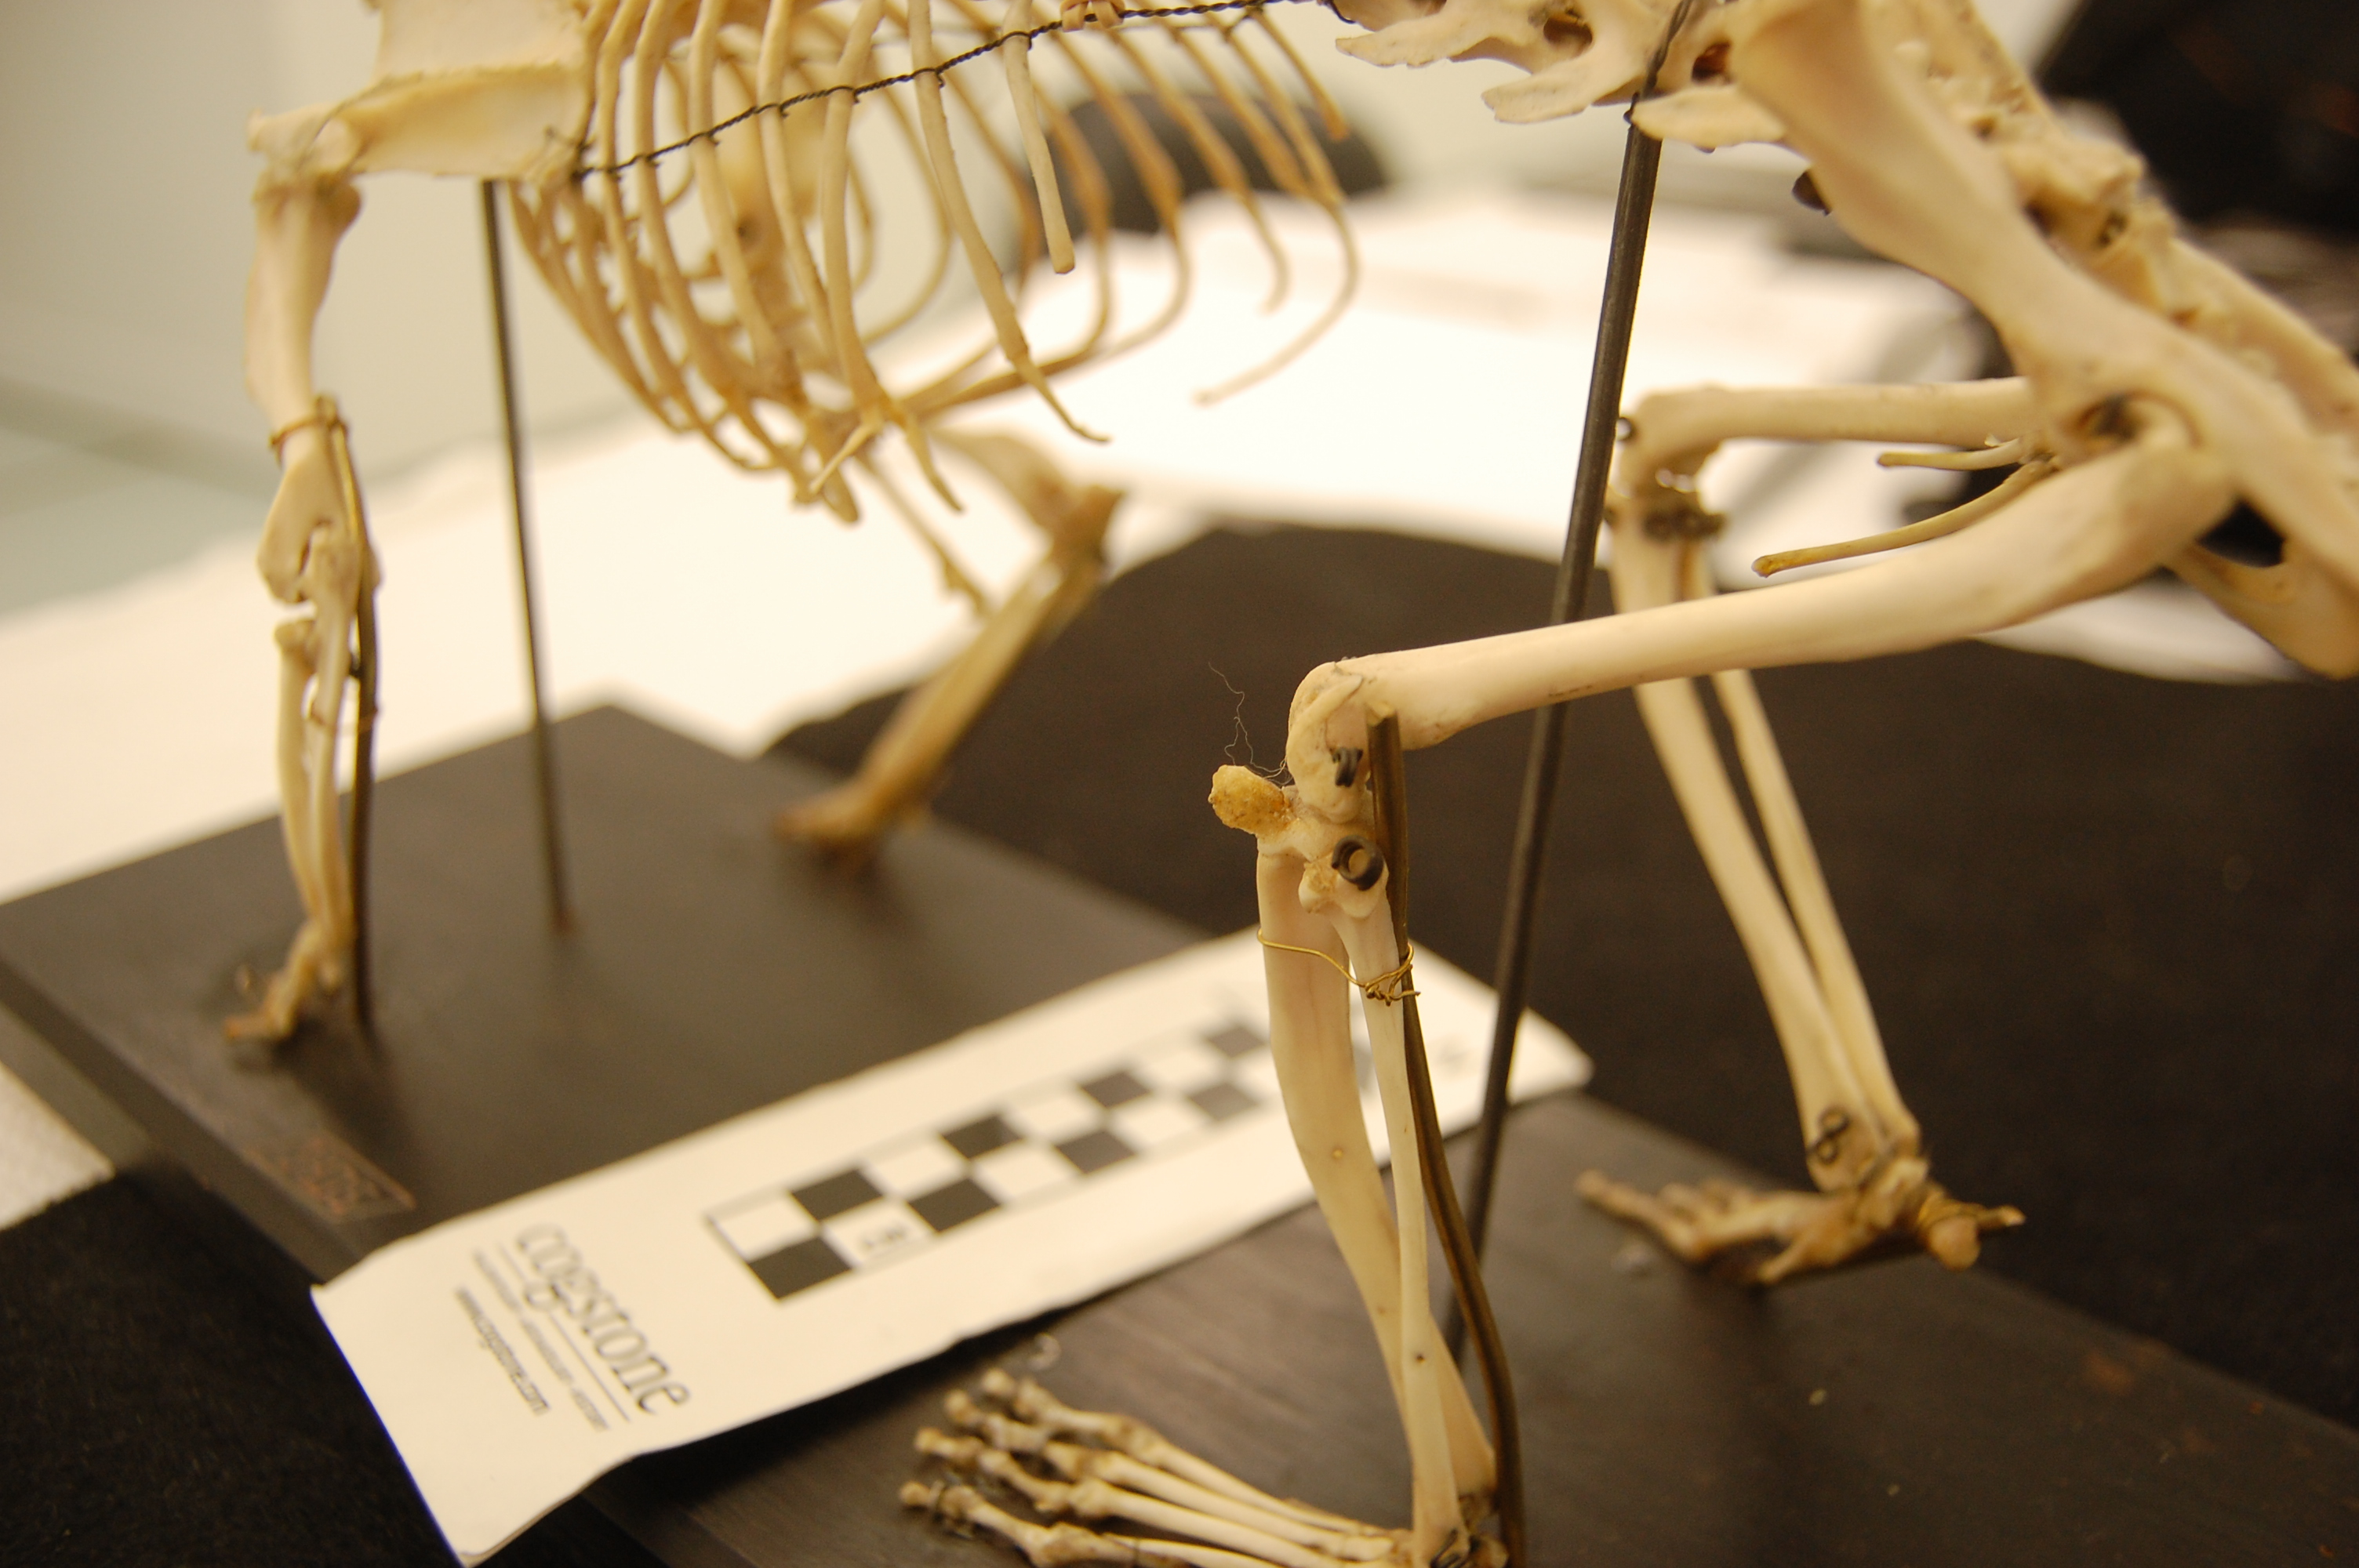
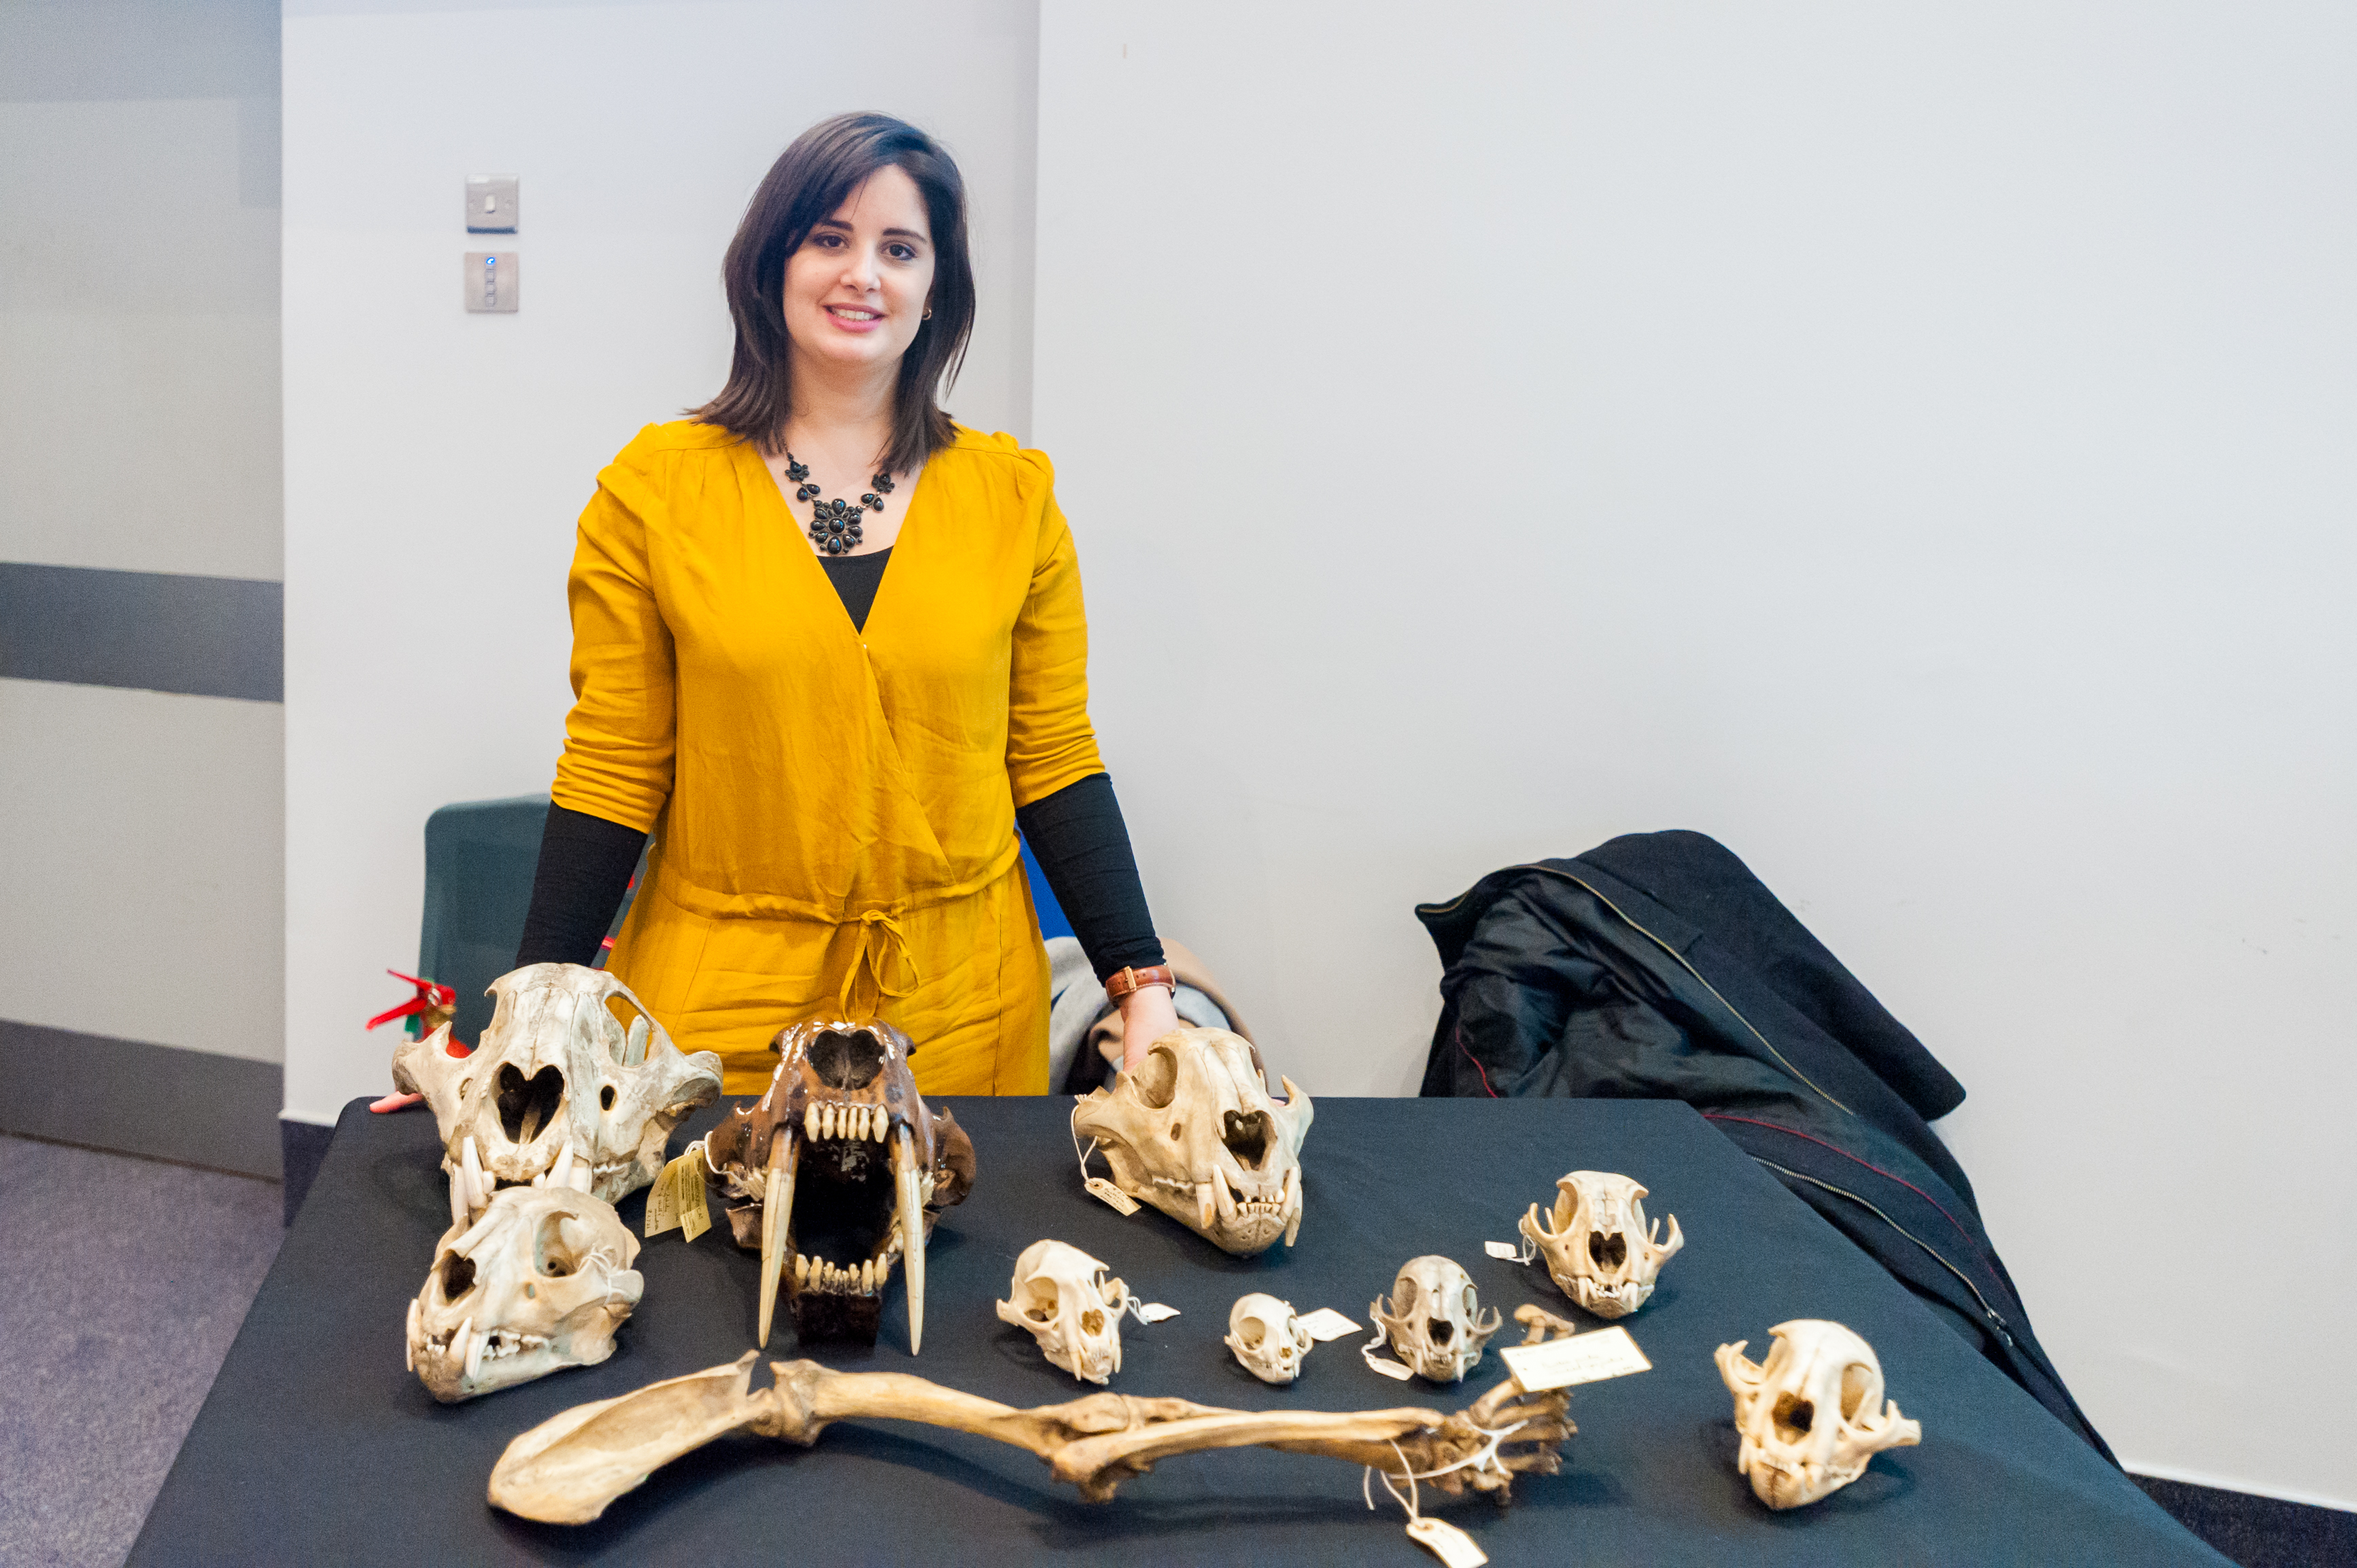
Disparity of skeletal pectoral appendages to work with from lobe-fins to tetrapods.
Again, it’s a lengthy, detailed study (31 pages) but designed as a review and meta-analysis that introduces readers to the data and ideas and then builds on them in new ways. I feel that this was a synthesis that was badly needed to tie together disparate observations and speculations on what the many, many obvious bumps, squiggles, crests and tuberosities on fossil tetrapods/cousins “mean” in terms of soft tissues. The figures here tell the basic story; Julia, as usual, rocked it with some lovely scientific illustration! Short message: the large number of pectoral limb muscles in living tetrapods probably didn’t evolve until limbs with digits evolved, but that number might go back to the common ancestor of all tetrapods, rather than more recently. BUT there are strong hints that earlier tetrapodomorph “fishapods” had some of those novel muscles already, so it was a more stepwise/gradual pattern of evolution than a simple punctuated event or two.

Colour maps of reconstructed right fin/limb muscles in tetrapodomorph sarcopterygian (~”fishapod”) and tetrapod most recent common ancestors. Some are less ambiguous than others.
That study opens the way to do proper biomechanical studies (like the Mussaurus study) of muscle actions, functions… even locomotor dynamics (like the mouse study)– and ooh, I’ve now tied all three studies together, tidily wrapped up with a scientific bow! There you have it. I’m looking forward to sharing more new science in 2018. We have some big, big plans!